OmniPGW 监控与指标指南
Prometheus 集成与操作监控
由 Omnitouch 网络服务提供
目录
概述
OmniPGW 提供两种互补的监控方法:
1. 实时 Web UI(在此简要介绍,详细信息请参见各自的接口文档)
- 实时会话查看器
- PFCP 对等状态
- Diameter 对等连接
- 单个会话检查
2. Prometheus 指标(本文档的主要重点)
- 历史趋势和分析
- 告警和通知
- 性能指标
- 容量规划
本文档重点关注 Prometheus 指标。有关 Web UI 的详细信息,请参见:
Prometheus 指标概述
OmniPGW 暴露 Prometheus 兼容指标,以全面监控系统健康、性能和容量。这使得运营团队能够:
- 监控系统健康 - 跟踪活动会话、分配和错误
- 容量规划 - 理解资源利用趋势
- 性能分析 - 测量消息处理延迟
- 告警 - 主动通知问题
- 调试 - 确定问题的根本原因
监控架构
指标端点
配置
在 config/runtime.exs 中启用指标:
config :pgw_c,
  metrics: %{
    enabled: true,
    ip_address: "0.0.0.0",  # 绑定到所有接口
    port: 9090,              # HTTP 端口
    registry_poll_period_ms: 5_000  # 轮询间隔
  }
访问指标
HTTP 端点:
http://<omnipgw_ip>:<port>/metrics
示例:
curl http://10.0.0.20:9090/metrics
输出格式
指标以 Prometheus 文本格式 暴露:
# HELP teid_registry_count The number of TEID registered to sessions
# TYPE teid_registry_count gauge
teid_registry_count 150

# HELP address_registry_count The number of addresses registered to sessions
# TYPE address_registry_count gauge
address_registry_count 150

# HELP s5s8_inbound_messages_total The total number of messages received from S5/S8 peers
# TYPE s5s8_inbound_messages_total counter
s5s8_inbound_messages_total{message_type="create_session_request"} 1523
s5s8_inbound_messages_total{message_type="delete_session_request"} 1487
可用指标
OmniPGW 暴露以下指标类别:
会话指标
活动会话计数:
| 指标名称 | 类型 | 描述 |
|---|---|---|
teid_registry_count | Gauge | 活动 S5/S8 会话(TEID 计数) |
seid_registry_count | Gauge | 活动 PFCP 会话(SEID 计数) |
session_id_registry_count | Gauge | 活动 Gx 会话(Diameter Session-ID 计数) |
session_registry_count | Gauge | 活动会话(IMSI, EBI 对) |
address_registry_count | Gauge | 分配的 UE IP 地址 |
charging_id_registry_count | Gauge | 活动计费 ID(请参见 数据 CDR 格式 以获取 CDR 计费记录) |
sxb_sequence_number_registry_count | Gauge | 待处理 PFCP 响应(等待响应) |
s5s8_sequence_number_registry_count | Gauge | 待处理 S5/S8 响应(等待响应) |
sxb_peer_registry_count | Gauge | 注册的 PFCP 对等进程数量 |
用法:
# 当前活动会话
teid_registry_count

# 会话创建速率(每秒)
rate(teid_registry_count[5m])

# 最近一小时的峰值会话
max_over_time(teid_registry_count[1h])
消息计数器
S5/S8 (GTP-C) 消息:
| 指标名称 | 类型 | 标签 | 描述 |
|---|---|---|---|
s5s8_inbound_messages_total | Counter | message_type | 总入站 S5/S8 消息 |
s5s8_outbound_messages_total | Counter | message_type | 总出站 S5/S8 消息 |
s5s8_inbound_errors_total | Counter | message_type | S5/S8 处理错误 |
消息类型:
create_session_requestcreate_session_responsedelete_session_requestdelete_session_responsecreate_bearer_requestdelete_bearer_request
Sxb (PFCP) 消息:
| 指标名称 | 类型 | 标签 | 描述 |
|---|---|---|---|
sxb_inbound_messages_total | Counter | message_type | 总入站 PFCP 消息 |
sxb_outbound_messages_total | Counter | message_type | 总出站 PFCP 消息 |
sxb_inbound_errors_total | Counter | message_type | PFCP 入站处理错误 |
sxb_outbound_errors_total | Counter | message_type | PFCP 出站处理错误 |
消息类型:
association_setup_requestassociation_setup_responseheartbeat_requestheartbeat_responsesession_establishment_requestsession_establishment_responsesession_modification_requestsession_deletion_request
Gx (Diameter) 消息:
| 指标名称 | 类型 | 标签 | 描述 |
|---|---|---|---|
gx_inbound_messages_total | Counter | message_type | 总入站 Diameter 消息 |
gx_outbound_messages_total | Counter | message_type | 总出站 Diameter 消息 |
gx_inbound_errors_total | Counter | message_type | Diameter 入站处理错误 |
gx_outbound_errors_total | Counter | message_type | Diameter 出站处理错误 |
gx_outbound_responses_total | Counter | message_type, result_code_class, diameter_host | 按结果代码类别和对等主机分类的 Diameter 响应 |
消息类型:
gx_CCA(Credit-Control-Answer)gx_CCR(Credit-Control-Request)gx_RAA(Re-Auth-Answer)gx_RAR(Re-Auth-Request)
结果代码类别(用于 gx_outbound_responses_total):
2xxx- 成功响应(例如,2001 DIAMETER_SUCCESS)3xxx- 协议错误(例如,3001 DIAMETER_COMMAND_UNSUPPORTED)4xxx- 瞬态故障(例如,4001 DIAMETER_AUTHENTICATION_REJECTED)5xxx- 永久故障(例如,5012 DIAMETER_UNABLE_TO_COMPLY)
用法示例:
# 监控 Gx 响应成功率
sum(rate(gx_outbound_responses_total{result_code_class="2xxx"}[5m])) /
sum(rate(gx_outbound_responses_total[5m])) * 100

# 按 PCRF 主机跟踪失败
rate(gx_outbound_responses_total{result_code_class!="2xxx"}[5m]) by (diameter_host)

# 计算成功的 Re-Auth-Answer 消息总数
gx_outbound_responses_total{message_type="gx_RAA",result_code_class="2xxx"}

# 针对特定 PCRF 的高失败率发出警报
rate(gx_outbound_responses_total{result_code_class=~"4xxx|5xxx",diameter_host="pcrf.example.com"}[5m]) > 0.1
错误处理:
| 指标名称 | 类型 | 标签 | 描述 |
|---|---|---|---|
rescues_total | Counter | module, function | 总救援块命中(异常处理) |
延迟指标
入站消息处理持续时间:
| 指标名称 | 类型 | 标签 | 描述 |
|---|---|---|---|
s5s8_inbound_handling_duration | Histogram | request_message_type | S5/S8 消息处理时间(包括解码、编码、发送、接收) |
sxb_inbound_handling_duration | Histogram | request_message_type | PFCP 消息处理时间(包括解码、编码、发送、接收) |
gx_inbound_handling_duration | Histogram | request_message_type | Diameter 消息处理时间(包括解码、编码、发送、接收) |
出站事务持续时间:
| 指标名称 | 类型 | 标签 | 描述 |
|---|---|---|---|
s5s8_outbound_transaction_duration | Histogram | request_message_type | S5/S8 请求-响应往返时间 |
sxb_outbound_transaction_duration | Histogram | request_message_type | PFCP 请求-响应往返时间(不包括编码/解码) |
gx_outbound_transaction_duration | Histogram | request_message_type | Diameter 请求-响应往返时间(包括编码/解码) |
桶(秒):
- 值:0.0001, 0.0005, 0.001, 0.005, 0.01, 0.05, 0.1, 0.5, 1.0, 5.0
- (100µs, 500µs, 1ms, 5ms, 10ms, 50ms, 100ms, 500ms, 1s, 5s)
用法:
# 95th 百分位 S5/S8 延迟
histogram_quantile(0.95,
  rate(s5s8_inbound_handling_duration_bucket[5m])
)

# 平均 PFCP 延迟
rate(sxb_inbound_handling_duration_sum[5m]) /
rate(sxb_inbound_handling_duration_count[5m])
UPF 健康监控
UPF 对等指标:
| 指标名称 | 类型 | 标签 | 描述 |
|---|---|---|---|
upf_peers_total | Gauge | - | 注册的 UPF 对等总数 |
upf_peers_healthy | Gauge | - | 健康的 UPF 对等数量(关联 + 心跳正常) |
upf_peers_unhealthy | Gauge | - | 不健康的 UPF 对等数量 |
upf_peers_associated | Gauge | - | 具有活动 PFCP 关联的 UPF 对等数量 |
upf_peers_unassociated | Gauge | - | 没有 PFCP 关联的 UPF 对等数量 |
upf_peer_healthy | Gauge | peer_ip | 特定 UPF 的健康状态(1=健康,0=不健康) |
upf_peer_missed_heartbeats | Gauge | peer_ip | 特定 UPF 的连续丢失心跳次数 |
用法:
# 监控 UPF 池健康
upf_peers_healthy / upf_peers_total

# 针对不健康的 UPF 发出警报
upf_peers_unhealthy > 0

# 跟踪特定 UPF 健康
upf_peer_healthy{peer_ip="10.98.0.20"}

# 确定心跳问题的 UPF
upf_peer_missed_heartbeats > 2
告警示例:
# 当 UPF 下线时发出警报
- alert: UPF_Peer_Down
  expr: upf_peer_healthy == 0
  for: 1m
  labels:
    severity: critical
  annotations:
    summary: "UPF {{ $labels.peer_ip }} 已下线"
    description: "UPF 对等未响应 PFCP 心跳"

# 当多个 UPF 下线时发出警报
- alert: UPF_Pool_Degraded
  expr: (upf_peers_healthy / upf_peers_total) < 0.5
  for: 2m
  labels:
    severity: critical
  annotations:
    summary: "UPF 池降级"
    description: "只有 {{ $value | humanizePercentage }} 的 UPF 是健康的"

# 关于丢失心跳的警告
- alert: UPF_Heartbeat_Issues
  expr: upf_peer_missed_heartbeats > 2
  for: 30s
  labels:
    severity: warning
  annotations:
    summary: "UPF {{ $labels.peer_ip }} 心跳问题"
    description: "{{ $value }} 次连续丢失心跳"
P-CSCF 健康监控
P-CSCF 服务器指标:
| 指标名称 | 类型 | 标签 | 描述 |
|---|---|---|---|
pcscf_fqdns_total | Gauge | - | 正在监控的 P-CSCF FQDN 总数 |
pcscf_fqdns_resolved | Gauge | - | 成功通过 DNS 解析的 P-CSCF FQDN |
pcscf_fqdns_failed | Gauge | - | 解析失败的 P-CSCF FQDN |
pcscf_servers_total | Gauge | - | 发现的 P-CSCF 服务器总数 |
pcscf_servers_healthy | Gauge | fqdn | 每个 FQDN 的健康 P-CSCF 服务器 |
pcscf_servers_unhealthy | Gauge | fqdn | 每个 FQDN 的不健康 P-CSCF 服务器 |
请参见: P-CSCF 监控指南 以获取详细的 IMS 健康跟踪。
许可证指标
许可证状态:
| 指标名称 | 类型 | 描述 |
|---|---|---|
license_status | Gauge | 当前许可证状态(1 = 有效,0 = 无效) |
用法:
# 检查许可证是否有效
license_status == 1

# 针对无效许可证发出警报
license_status == 0
告警示例:
- alert: PGW_C_License_Invalid
  expr: license_status == 0
  for: 1m
  labels:
    severity: critical
  annotations:
    summary: "PGW-C 许可证无效或过期"
    description: "许可证状态无效 - 创建会话请求被阻止"
无效许可证的影响:
当许可证无效或许可证服务器无法访问时,创建会话请求将被拒绝,并带有 GTP-C 原因代码 “没有可用资源” (73)。这在数据包捕获中可见,如下所示:
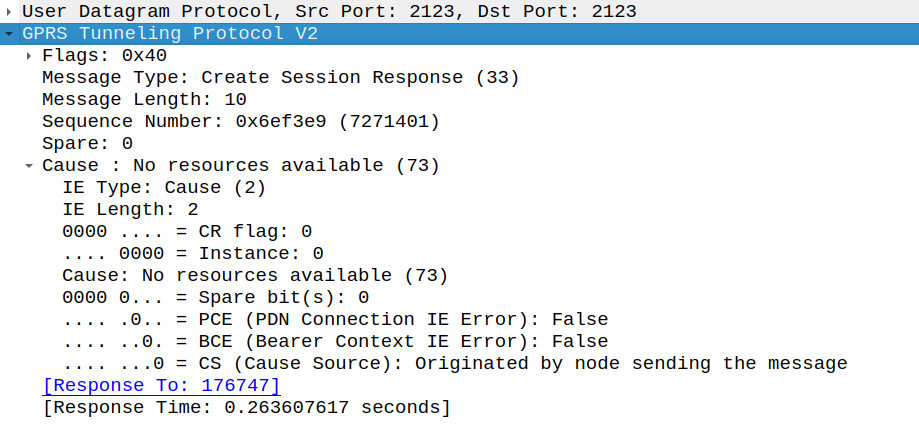
Wireshark 捕获显示许可证无效时的创建会话响应,原因是“没有可用资源”
注意:
- 注册到许可证服务器的产品名称:
omnipgwc - 许可证服务器 URL 在
config/runtime.exs中的:license_client下配置 - 当许可证无效时(
license_status == 0),创建会话请求被阻止,GTP-C 原因代码为 73(没有可用资源) - 无论许可证状态如何,UI 和监控仍然可以访问
- Diameter、GTP-C 和 PFCP 对等继续保持连接
- 现有会话不受影响 - 仅阻止新会话的创建
系统指标
Erlang VM 指标:
| 指标名称 | 类型 | 描述 |
|---|---|---|
vm_memory_total | Gauge | 总 VM 内存(字节) |
vm_memory_processes | Gauge | 进程使用的内存 |
vm_memory_system | Gauge | 系统使用的内存 |
vm_system_process_count | Gauge | 总 Erlang 进程 |
vm_system_port_count | Gauge | 总打开端口 |
Prometheus 配置
抓取配置
将 OmniPGW 添加到 Prometheus prometheus.yml:
# prometheus.yml
global:
  scrape_interval: 15s
  evaluation_interval: 15s

scrape_configs:
  - job_name: 'omnipgw'
    static_configs:
      - targets: ['10.0.0.20:9090']
        labels:
          instance: 'omnipgw-01'
          environment: 'production'
          site: 'datacenter-1'
多个 OmniPGW 实例
scrape_configs:
  - job_name: 'omnipgw'
    static_configs:
      - targets:
          - '10.0.0.20:9090'
          - '10.0.0.21:9090'
          - '10.0.0.22:9090'
        labels:
          environment: 'production'
服务发现
Kubernetes:
scrape_configs:
  - job_name: 'omnipgw'
    kubernetes_sd_configs:
      - role: pod
    relabel_configs:
      - source_labels: [__meta_kubernetes_pod_label_app]
        action: keep
        regex: omnipgw
      - source_labels: [__meta_kubernetes_pod_ip]
        target_label: __address__
        replacement: '${1}:9090'
验证
测试抓取:
# 检查 Prometheus 目标
curl http://prometheus:9090/api/v1/targets

# 查询一个指标
curl 'http://prometheus:9090/api/v1/query?query=teid_registry_count'
Grafana 仪表板
仪表板设置
1. 添加 Prometheus 数据源:
配置 → 数据源 → 添加数据源 → Prometheus
URL: http://prometheus:9090
2. 导入仪表板:
创建一个新仪表板或从 JSON 导入。
关键面板
面板 1:活动会话
# 查询
teid_registry_count

# 面板类型:Gauge
# 阈值:
#   绿色:< 5000
#   黄色:5000-8000
#   红色:> 8000
面板 2:会话速率
# 查询
rate(s5s8_inbound_messages_total{message_type="create_session_request"}[5m])

# 面板类型:图形
# 单位:请求/秒
面板 3:IP 池利用率
# 查询(对于 /24 子网,254 个 IP)
(address_registry_count / 254) * 100

# 面板类型:Gauge
# 单位:百分比(0-100)
# 阈值:
#   绿色:< 70%
#   黄色:70-85%
#   红色:> 85%
面板 4:消息延迟(95th 百分位)
# 查询
histogram_quantile(0.95,
  rate(s5s8_inbound_handling_duration_bucket{request_message_type="create_session_request"}[5m])
)

# 面板类型:图形
# 单位:毫秒
面板 5:错误率
# 查询
rate(s5s8_inbound_errors_total[5m])

# 面板类型:图形
# 单位:错误/秒
# 警报阈值:> 0.1
面板 6:Gx 响应成功率
# 查询:计算成功 Gx 响应的百分比
sum(rate(gx_outbound_responses_total{result_code_class="2xxx"}[5m])) /
sum(rate(gx_outbound_responses_total[5m])) * 100

# 面板类型:Gauge
# 单位:百分比(0-100)
# 阈值:
#   绿色:> 95%
#   黄色:90-95%
#   红色:< 90%
替代 - 按结果代码类别分解:
# 查询:按结果代码类别显示响应计数
sum(rate(gx_outbound_responses_total[5m])) by (result_code_class)

# 面板类型:饼图或条形图
# 图例:{{ result_code_class }}
替代 - 按 PCRF 响应状态:
# 查询:按 PCRF 主机显示响应
sum(rate(gx_outbound_responses_total[5m])) by (diameter_host, result_code_class)

# 面板类型:堆叠条形图
# 图例:{{ diameter_host }} - {{ result_code_class }}
面板 7:UPF 健康状态
# 查询:整体池健康百分比
(upf_peers_healthy / upf_peers_total) * 100

# 面板类型:Gauge
# 单位:百分比(0-100)
# 阈值:
#   绿色:100%
#   黄色:50-99%
#   红色:< 50%
替代 - 每个 UPF 状态:
# 查询:单个 UPF 健康
upf_peer_healthy

# 面板类型:Stat
# 映射:
#   1 = "UP"(绿色)
#   0 = "DOWN"(红色)
完整仪表板示例
{
  "dashboard": {
    "title": "OmniPGW - 操作仪表板",
    "panels": [
      {
        "title": "活动会话",
        "targets": [
          {
            "expr": "teid_registry_count",
            "legendFormat": "活动会话"
          }
        ],
        "type": "graph"
      },
      {
        "title": "会话创建速率",
        "targets": [
          {
            "expr": "rate(s5s8_inbound_messages_total{message_type=\"create_session_request\"}[5m])",
            "legendFormat": "会话/秒"
          }
        ],
        "type": "graph"
      },
      {
        "title": "IP 池利用率",
        "targets": [
          {
            "expr": "(address_registry_count / 254) * 100",
            "legendFormat": "池使用率 %"
          }
        ],
        "type": "gauge"
      },
      {
        "title": "消息延迟(p95)",
        "targets": [
          {
            "expr": "histogram_quantile(0.95, rate(s5s8_inbound_handling_duration_bucket[5m]))",
            "legendFormat": "S5/S8 p95"
          },
          {
            "expr": "histogram_quantile(0.95, rate(sxb_inbound_handling_duration_bucket[5m]))",
            "legendFormat": "PFCP p95"
          }
        ],
        "type": "graph"
      }
    ]
  }
}
告警
告警规则
创建 omnipgw_alerts.yml:
groups:
  - name: omnipgw
    interval: 30s
    rules:
      # 会话计数告警
      - alert: OmniPGW_HighSessionCount
        expr: teid_registry_count > 8000
        for: 5m
        labels:
          severity: warning
        annotations:
          summary: "OmniPGW 高会话计数"
          description: "{{ $value }} 活动会话(阈值:8000)"

      - alert: OmniPGW_SessionCountCritical
        expr: teid_registry_count > 9500
        for: 2m
        labels:
          severity: critical
        annotations:
          summary: "OmniPGW 会话计数临界"
          description: "{{ $value }} 活动会话接近容量"

      # IP 池告警
      - alert: OmniPGW_IPPoolUtilizationHigh
        expr: (address_registry_count / 254) * 100 > 80
        for: 10m
        labels:
          severity: warning
        annotations:
          summary: "OmniPGW IP 池利用率高"
          description: "IP 池 {{ $value }}% 已利用"

      - alert: OmniPGW_IPPoolExhausted
        expr: address_registry_count >= 254
        for: 1m
        labels:
          severity: critical
        annotations:
          summary: "OmniPGW IP 池耗尽"
          description: "没有可分配的 IP"

      # 错误率告警
      - alert: OmniPGW_HighErrorRate
        expr: rate(s5s8_inbound_errors_total[5m]) > 0.1
        for: 5m
        labels:
          severity: warning
        annotations:
          summary: "OmniPGW 高错误率"
          description: "{{ $value }} 错误/秒在 S5/S8 接口"

      - alert: OmniPGW_GxErrorRate
        expr: rate(gx_inbound_errors_total[5m]) > 0.05
        for: 5m
        labels:
          severity: warning
        annotations:
          summary: "OmniPGW Gx 错误"
          description: "{{ $value }} Diameter 错误/秒"

      # Gx 响应告警
      - alert: OmniPGW_GxResponseFailureRate
        expr: |
          sum(rate(gx_outbound_responses_total{result_code_class!="2xxx"}[5m])) /
          sum(rate(gx_outbound_responses_total[5m])) > 0.1
        for: 5m
        labels:
          severity: warning
        annotations:
          summary: "OmniPGW 高 Gx 响应失败率"
          description: "{{ $value | humanizePercentage }} 的 Gx 响应是失败(非 2xxx 结果代码)"

      - alert: OmniPGW_GxPCRFFailures
        expr: rate(gx_outbound_responses_total{result_code_class=~"4xxx|5xxx"}[5m]) by (diameter_host) > 0.05
        for: 3m
        labels:
          severity: warning
        annotations:
          summary: "PCRF {{ $labels.diameter_host }} 收到失败响应"
          description: "{{ $value }} 对 PCRF {{ $labels.diameter_host }} 的失败响应/秒"

      # UPF 健康告警
      - alert: OmniPGW_UPF_PeerDown
        expr: upf_peer_healthy == 0
        for: 1m
        labels:
          severity: critical
        annotations:
          summary: "UPF 对等 {{ $labels.peer_ip }} 已下线"
          description: "UPF 未响应 PFCP 心跳"

      - alert: OmniPGW_UPF_PoolDegraded
        expr: (upf_peers_healthy / upf_peers_total) < 0.5
        for: 2m
        labels:
          severity: critical
        annotations:
          summary: "UPF 池降级"
          description: "{{ $value | humanizePercentage }} 的 UPF 是健康的 (< 50%)"

      - alert: OmniPGW_UPF_HeartbeatFailures
        expr: upf_peer_missed_heartbeats > 2
        for: 30s
        labels:
          severity: warning
        annotations:
          summary: "UPF {{ $labels.peer_ip }} 心跳失败"
          description: "{{ $value }} 次连续丢失心跳"

      - alert: OmniPGW_UPF_AllDown
        expr: upf_peers_healthy == 0 and upf_peers_total > 0
        for: 30s
        labels:
          severity: critical
        annotations:
          summary: "所有 UPF 对等已下线"
          description: "没有健康的 UPF 可用于会话创建"

      # 延迟告警
      - alert: OmniPGW_HighLatency
        expr: |
          histogram_quantile(0.95,
            rate(s5s8_inbound_handling_duration_bucket[5m])
          ) > 100000
        for: 5m
        labels:
          severity: warning
        annotations:
          summary: "OmniPGW 高消息延迟"
          description: "p95 延迟 {{ $value }}µs (> 100ms)"

      # 系统告警
      - alert: OmniPGW_HighMemoryUsage
        expr: vm_memory_total > 2000000000
        for: 10m
        labels:
          severity: warning
        annotations:
          summary: "OmniPGW 高内存使用"
          description: "VM 使用 {{ $value | humanize }}B 内存"

      - alert: OmniPGW_HighProcessCount
        expr: vm_system_process_count > 100000
        for: 10m
        labels:
          severity: warning
        annotations:
          summary: "OmniPGW 高进程计数"
          description: "{{ $value }} Erlang 进程(潜在泄漏)"
AlertManager 配置
# alertmanager.yml
global:
  resolve_timeout: 5m

route:
  receiver: 'ops-team'
  group_by: ['alertname', 'instance']
  group_wait: 10s
  group_interval: 10s
  repeat_interval: 12h

  routes:
    - match:
        severity: critical
      receiver: 'pagerduty'

    - match:
        severity: warning
      receiver: 'slack'

receivers:
  - name: 'ops-team'
    email_configs:
      - to: 'ops@example.com'

  - name: 'slack'
    slack_configs:
      - api_url: 'https://hooks.slack.com/services/YOUR/SLACK/WEBHOOK'
        channel: '#omnipgw-alerts'
        title: 'OmniPGW 警报:{{ .GroupLabels.alertname }}'
        text: '{{ range .Alerts }}{{ .Annotations.description }}{{ end }}'

  - name: 'pagerduty'
    pagerduty_configs:
      - service_key: 'YOUR_PAGERDUTY_KEY'
性能监控
关键绩效指标 (KPI)
吞吐量查询
会话设置速率:
rate(s5s8_inbound_messages_total{message_type="create_session_request"}[5m])
会话拆除速率:
rate(s5s8_inbound_messages_total{message_type="delete_session_request"}[5m])
净会话增长:
rate(s5s8_inbound_messages_total{message_type="create_session_request"}[5m]) -
rate(s5s8_inbound_messages_total{message_type="delete_session_request"}[5m])
延迟分析
消息处理延迟(百分位数):
# p50(中位数)
histogram_quantile(0.50,
  rate(s5s8_inbound_handling_duration_bucket[5m])
)

# p95
histogram_quantile(0.95,
  rate(s5s8_inbound_handling_duration_bucket[5m])
)

# p99
histogram_quantile(0.99,
  rate(s5s8_inbound_handling_duration_bucket[5m])
)
按消息类型分解的延迟:
histogram_quantile(0.95,
  rate(s5s8_inbound_handling_duration_bucket[5m])
) by (request_message_type)
容量趋势
会话增长趋势(24小时):
teid_registry_count -
teid_registry_count offset 24h
剩余容量:
# 对于最大容量 10,000 会话
10000 - teid_registry_count
到达容量耗尽的时间:
# 基于 1 小时增长速率的容量耗尽天数
(10000 - teid_registry_count) /
(rate(teid_registry_count[1h]) * 86400)
故障排��指标
识别问题
问题:高会话拒绝率
查询:
rate(s5s8_inbound_errors_total[5m]) by (message_type)
行动:
- 检查错误日志
- 验证 PCRF 连接(Gx 错误)
- 检查 IP 池耗尽
问题:会话设置缓慢
查询:
histogram_quantile(0.95,
  rate(s5s8_inbound_handling_duration_bucket{request_message_type="create_session_request"}[5m])
)
行动:
- 检查 Gx 延迟(PCRF 响应时间)
- 检查 PFCP 延迟(PGW-U 响应时间)
- 审查系统资源使用情况
问题:PCRF 策略失败
查询:
# 整体 Gx 响应失败率
sum(rate(gx_outbound_responses_total{result_code_class!="2xxx"}[5m])) /
sum(rate(gx_outbound_responses_total[5m])) * 100

# 按 PCRF 主机分解
sum(rate(gx_outbound_responses_total[5m])) by (diameter_host, result_code_class)

# 特定结果代码类别
rate(gx_outbound_responses_total{result_code_class="5xxx"}[5m]) by (diameter_host)
行动:
- 检查 PCRF 连接和健康状况
- 审查 PCRF 中的订阅者配置文件(5xxx 错误通常表示策略问题)
- 验证 Diameter 对等配置
- 检查 PCRF 日志以获取相应错误
- 对于 5012(DIAMETER_UNABLE_TO_COMPLY),审查 Re-Auth-Request 处理
问题:怀疑内存泄漏
查询:
# 总内存趋势
rate(vm_memory_total[1h])

# 进程内存趋势
rate(vm_memory_processes[1h])

# 进程计数趋势
rate(vm_system_process_count[1h])
行动:
- 检查过期会话
- 审查注册计数
- 如果确认泄漏,请重启
调试查询
查找峰值会话时间:
max_over_time(teid_registry_count[24h])
比较当前与历史:
teid_registry_count /
avg_over_time(teid_registry_count[7d])
识别异常:
abs(
  teid_registry_count -
  avg_over_time(teid_registry_count[1h])
) > 100
最佳实践
指标收集
- 抓取间隔: 15-30 秒(平衡粒度与负载)
- 保留: 15 天以上以进行历史分析
- 标签: 使用一致的标签(实例、环境、站点)
仪表板设计
- 概览仪表板 - NOC 的高层 KPI
- 详细仪表板 - 每个接口的深入分析
- 故障排除仪表板 - 错误指标和日志
告警设计
- 避免告警疲劳 - 仅对可操作的问题发出告警
- 升级 - 警告 → 关键,逐步升级严重性
- 上下文 - 在告警描述中包含运行手册链接
相关文档
配置和设置
接口指标
- PFCP 接口 - PFCP 会话指标,UPF 健康监控
- Diameter Gx 接口 - Gx 策略指标,PCRF 交互跟踪
- Diameter Gy 接口 - Gy 计费指标,配额跟踪,OCS 超时
- S5/S8 接口 - GTP-C 消息指标,SGW-C 通信
专业监控
OmniPGW 监控指南 - 由 Omnitouch 网络服务提供