Operations Guide
This document covers operational monitoring and management features available in the Control Panel.
Related Documentation
Core Documentation
- 📋 Main README - Overview and quick start
- 🔧 Configuration Guide - System configuration reference
- 📊 Metrics Reference - Prometheus metrics and monitoring
Monitoring & Testing Tools
- 🧪 HLR & Call Simulator - Testing tools for HLR and call simulation
- 👥 IMS Conference Server - Conference management and monitoring
- 📈 Dialplan Metrics - Dialplan-specific metrics
Call Processing & Services
- 🔀 Dialplan Configuration - Call routing and dialplan reference
- 👥 Sh Interface - Subscriber data testing
- 💳 Online Charging - OCS testing
- 🔢 Number Translation - Number translation testing
- 📞 Voicemail - Voicemail management
Integration Interfaces
- 📡 SS7 MAP - HLR/MAP testing
- ⚙️ Supplementary Services - Emergency calling, call forwarding
- 📊 HOMER Integration - SIP trace and log correlation
Operations
This section covers operational monitoring and management features available in the OmniTAS Control Panel.
Table of Contents
- Subscribers View
- Call Detail Records (CDR)
- Active Calls Monitoring
- IMS Conference Server
- Gateway Status
- Diameter Peer Status
- Logs Viewer
- Cell Tower Database
- Call Simulator
- HLR/MAP Testing
- Other Views
Subscribers View
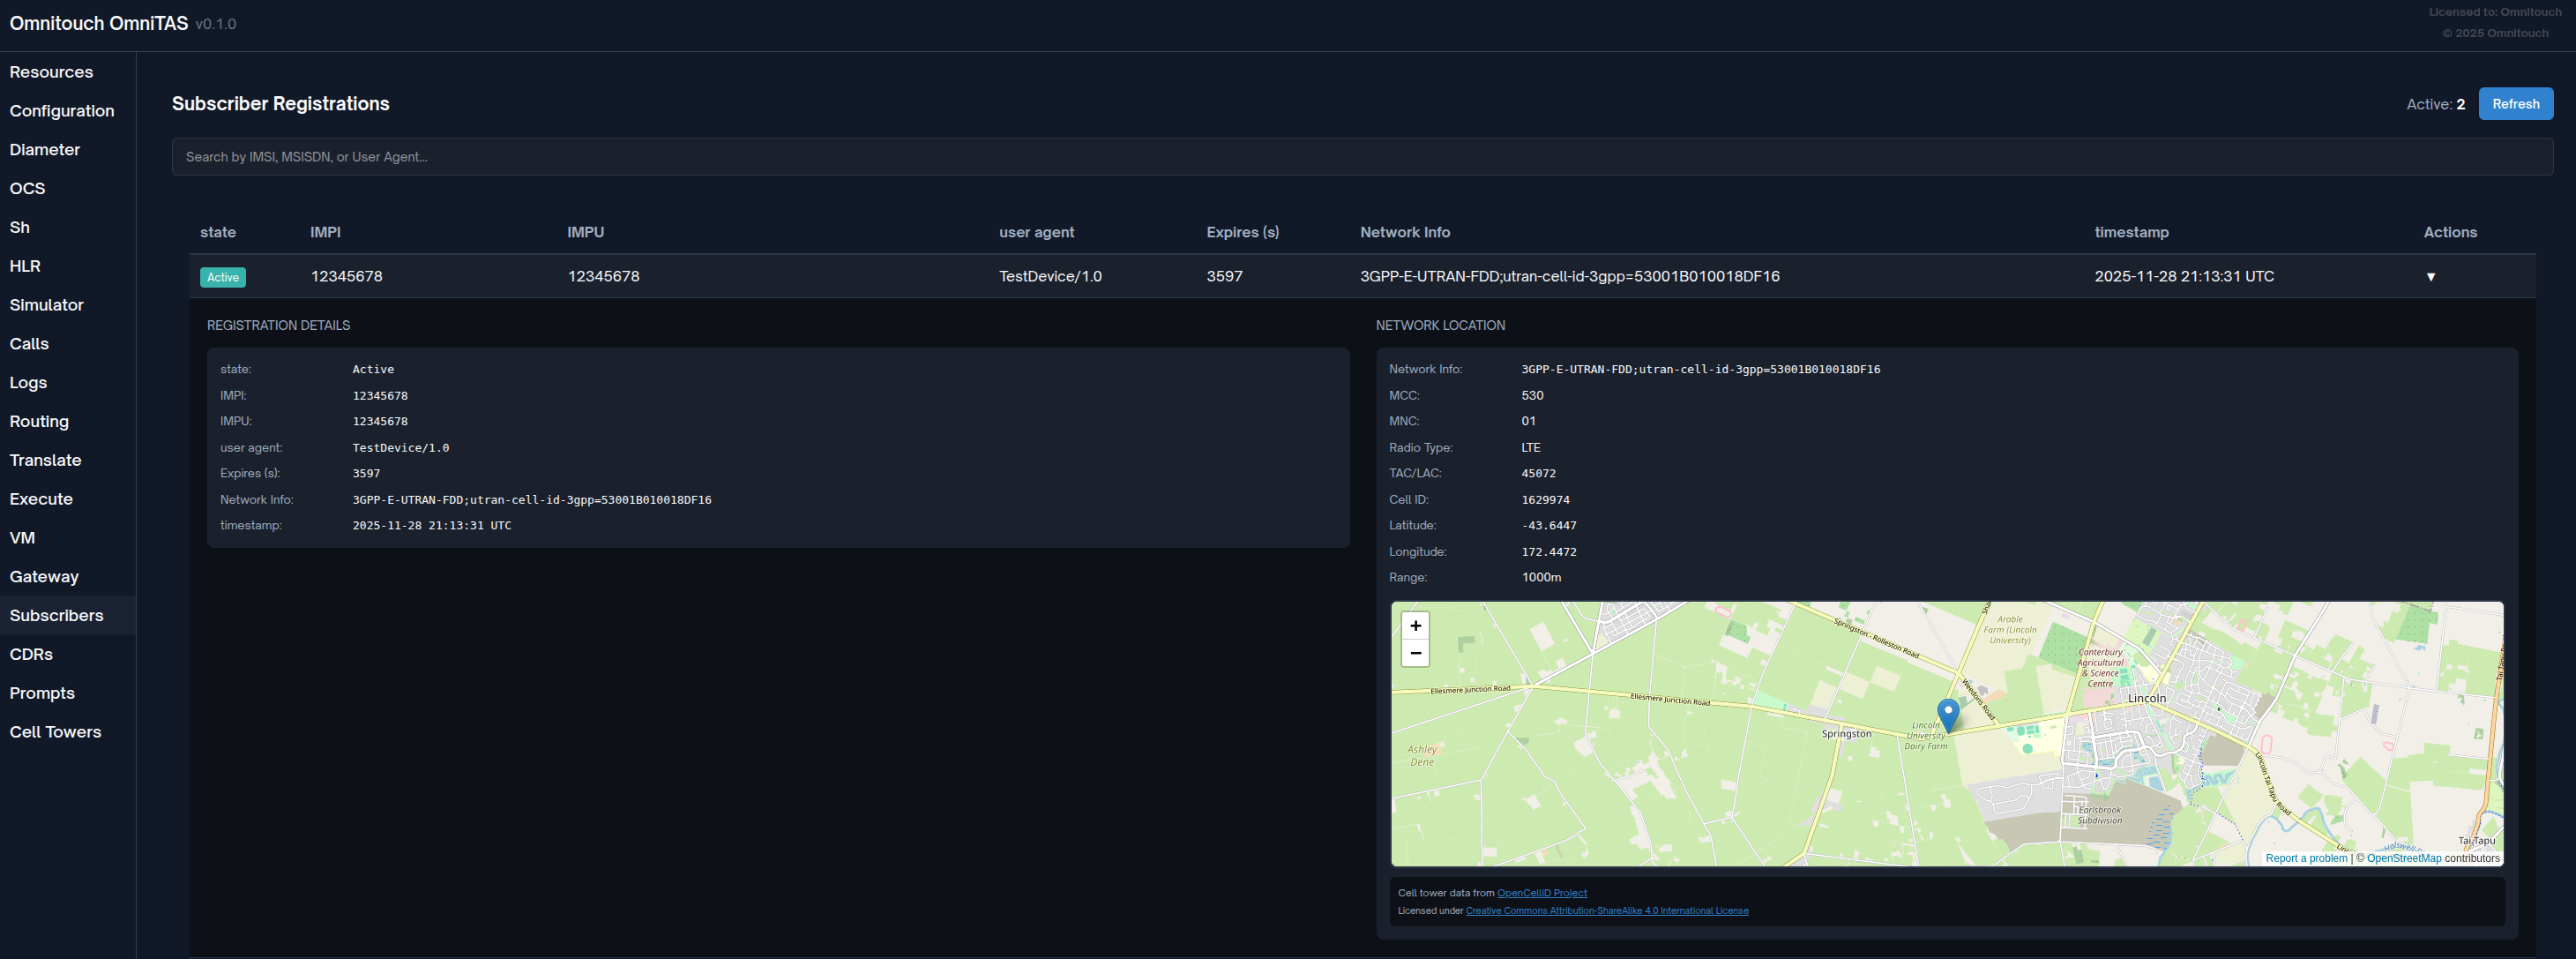
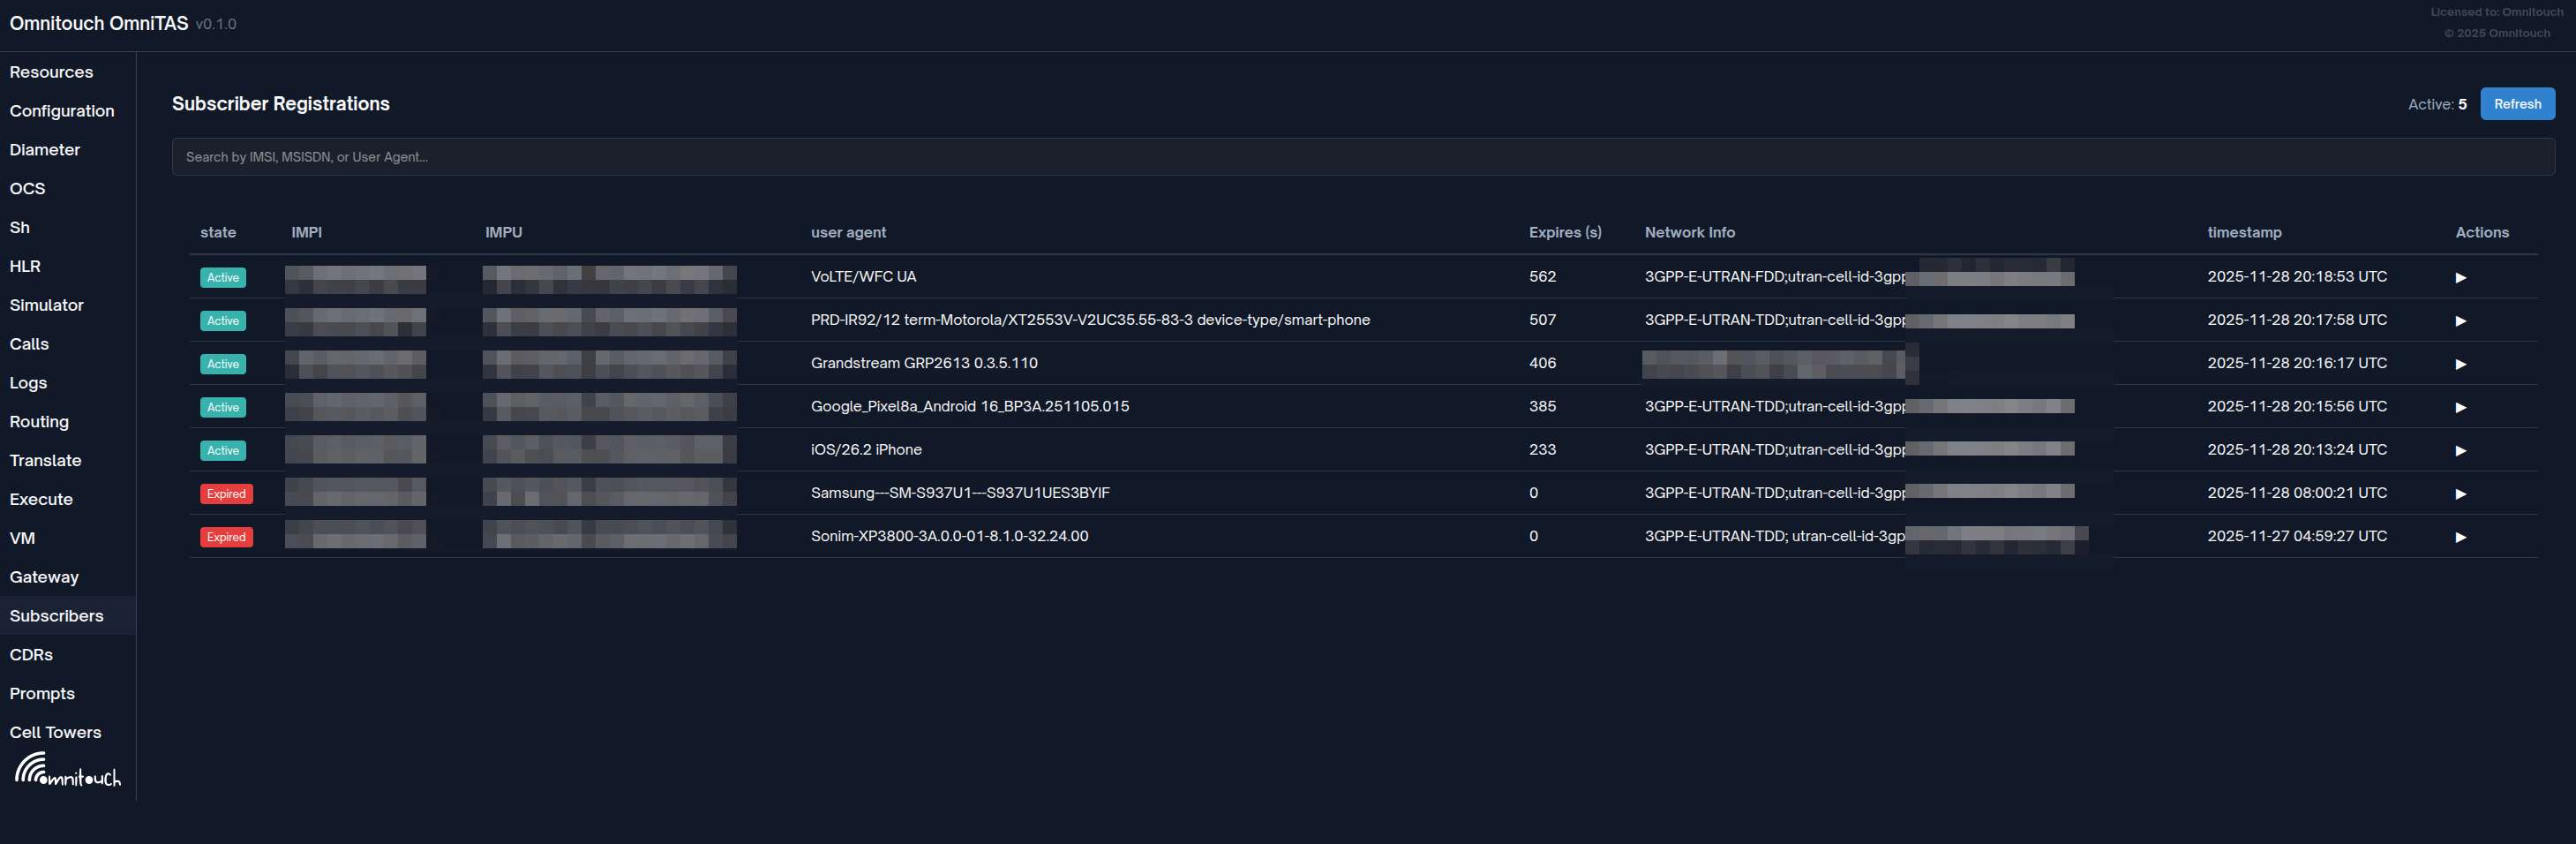
The Subscribers view provides real-time monitoring of IMS subscriber registrations stored in the Sofia SIP registration database.
Access: Navigate to /subscribers in the Control Panel
Features
- Registration List: View all active subscriber registrations
- Registration Details: Click on any registration to view complete details including:
- SIP User and Realm
- Contact URI
- Registration status and expiration
- Network information (IP, port, hostname)
- Authentication details
- Cell tower location (when available via P-Access-Network-Info)
- MCC/MNC, Radio Type, TAC/LAC, Cell ID
- Geographic coordinates and coverage range
- Interactive map view powered by OpenStreetMap and OpenCellID data
Data Source
Registration data is queried directly from the Sofia registration database, providing real-time visibility into subscriber attachment status. Cell tower locations are resolved using the OpenCellID database when subscribers provide P-Access-Network-Info headers in their SIP REGISTER messages.
Use Cases
- Monitor active subscriber registrations
- Verify subscriber attachment status
- Troubleshoot registration issues
- Audit subscriber connectivity
Call Detail Records (CDR)
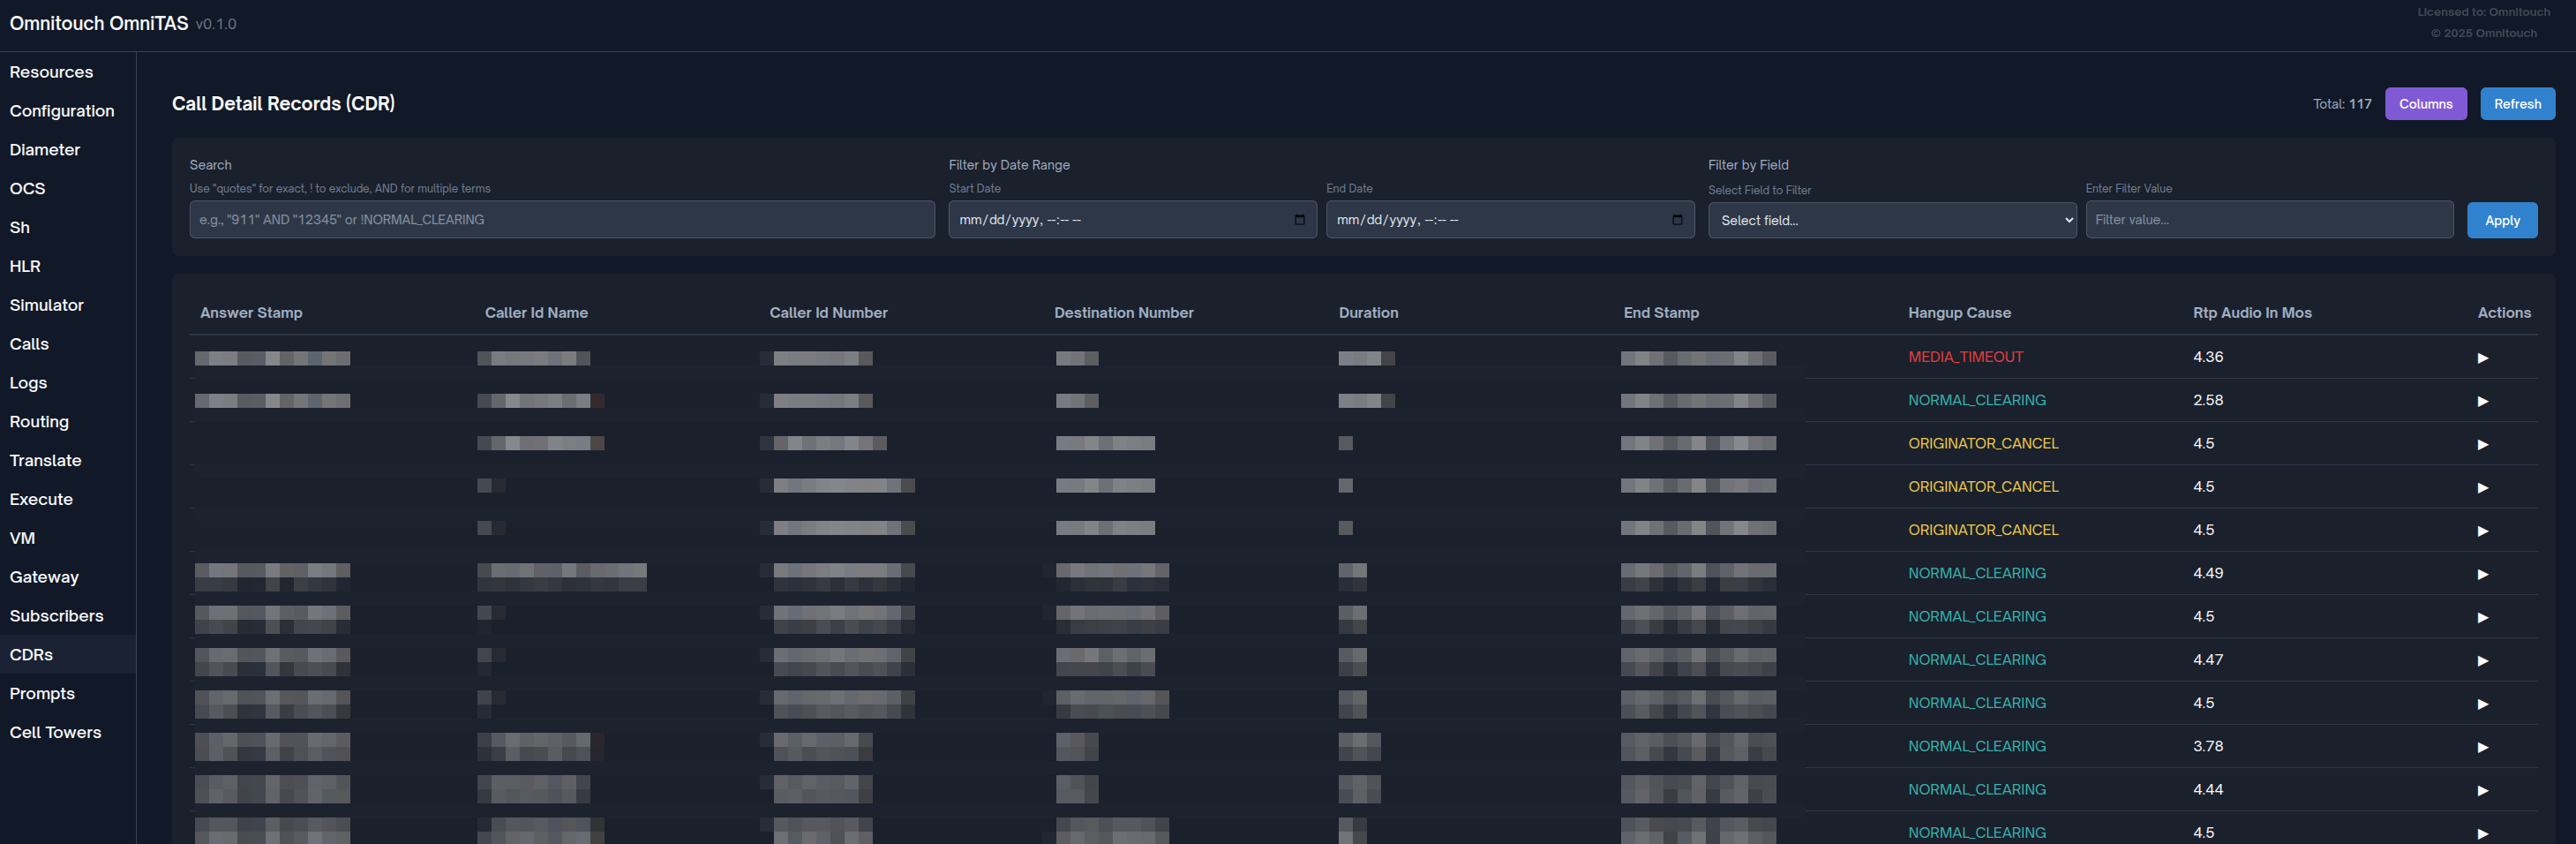
The CDR view provides access to call detail records stored by TAS for billing, troubleshooting, and analytics purposes.
Access: Navigate to /cdr in the Control Panel
Features
- Paginated View: Browse through call records (100 per page with Previous/Next controls)
- Advanced Search: Powerful search with support for exact match, inverse/exclude, and multiple terms
- Column Selection: Customize which fields to display
- Click "Columns" button to open column picker modal
- Select/deselect individual columns
- Select All / Deselect All quick actions
- Selection persists across sessions (saved to browser localStorage)
- Shows "X / Y columns" counter
- Sortable Columns: Click any column header to sort (ascending/descending)
- Visual indicators (▲ ascending, ▼ descending)
- Sorted column highlighted in blue
- Resets to page 1 when sorting changes
- Multiple Filter Options:
- Text Search: Search across all fields with advanced operators
- Date Range Filter: Filter by start/end date and time (datetime picker)
- Field-Specific Filter: Filter by exact field value (hangup cause, caller ID, destination, context)
- Active Filter Display: Visual chips show currently active filters
- Clear All: One-click removal of all active filters
- Detailed Information: Click on any CDR row to expand and view all fields:
- Call parties (caller ID name/number, destination number)
- Timestamps (start, answer, end)
- Duration and billed seconds
- Hangup cause (color-coded: green=normal, yellow=cancel, red=error)
- Call UUIDs (A-leg and B-leg)
- Context and account code
- All available database fields in alphabetical order
- Color-Coded Hangup Causes:
- 🟢 Green:
NORMAL_CLEARING - 🟡 Yellow: Cancelled calls
- 🔴 Red: Error conditions
- 🟢 Green:
- Total Count: Real-time display of total matching records
- Responsive Layout: Filters wrap appropriately on smaller screens
How to Use
-
Basic Viewing:
- Page loads with latest 100 CDR records (sorted by
start_stampdescending) - Total record count shown in top-right
- Use Previous / Next buttons to navigate pages
- Click any row to expand and see all fields
- Page loads with latest 100 CDR records (sorted by
-
Customize Columns:
- Click "Columns" button in top-right
- Modal shows all available fields
- Check/uncheck fields to show/hide columns
- Use "Select All" or "Deselect All" for quick selection
- Settings automatically saved to browser
- Close modal to apply changes
-
Sort Data:
- Click any column header to sort by that field
- First click: Descending (▼)
- Second click: Ascending (▲)
- Third click: Back to descending
- Sorted column highlighted in blue
-
Search Records:
- Enter search query in "Search" box
- Supports advanced operators (see Search Syntax below)
- Searches across multiple fields:
caller_id_number,destination_number,uuid,caller_id_name,hangup_cause - Click "Apply" to execute search
-
Filter by Date Range:
- Use "Start Date" and "End Date" datetime pickers
- Both dates required for date filtering
- Supports date and time selection
- Click "Apply" to filter
-
Filter by Specific Field:
- Select field from "Select Field to Filter" dropdown:
- Hangup Cause
- Caller ID
- Destination
- Context
- Enter exact value in "Enter Filter Value"
- Click "Apply" to filter
- Select field from "Select Field to Filter" dropdown:
-
Combine Filters:
- All filters can be used simultaneously:
- Text search + Date range + Field filter all work together
- Active filters shown as chips below the filter form
- Click "Clear All" to remove all filters at once
- All filters can be used simultaneously:
-
View Details:
- Click any CDR row to expand
- Shows all database fields in a grid layout
- Fields displayed in alphabetical order
- Hangup cause color-coded for quick identification
- Click row again to collapse
Advanced Search Syntax
The search box supports powerful query syntax for precise record filtering across multiple fields simultaneously.
How Search Works:
The search engine checks all searchable fields in each CDR record. A record is included in results when it matches your search criteria in any of these fields:
caller_id_numberdestination_numberuuidcaller_id_namehangup_cause
Search Operators (can be combined):
-
Contains Search (default):
- Syntax:
term(no quotes) - Matches: Records where any field contains the term anywhere within it
- SQL: Uses
LIKE '%term%'across all searchable fields joined withOR - Example:
61480matches "61480123456", "55561480999", etc.
- Syntax:
-
Exact Match:
- Syntax:
"term"(with double quotes) - Matches: Records where any field exactly equals the term
- SQL: Uses
= 'term'across all searchable fields joined withOR - Example:
"911"matches only exactly "911", not "9115" or "1911"
- Syntax:
-
Inverse/Exclude:
- Syntax:
!term(exclamation mark prefix, no quotes) - Matches: Records where no field contains the term
- SQL: Uses
NOT LIKE '%term%'across all searchable fields joined withAND - Example:
!NORMALexcludes any record with "NORMAL" in any field
- Syntax:
-
Exact Inverse/Exclude:
- Syntax:
!"term"(exclamation mark + double quotes) - Matches: Records where no field exactly equals the term
- SQL: Uses
!= 'term'across all searchable fields joined withAND - Example:
!"NORMAL_CLEARING"excludes records where any field is exactly "NORMAL_CLEARING"
- Syntax:
-
Multiple Terms with AND:
- Syntax:
term1 AND term2(case-insensitive AND) - Matches: Records matching all terms (each term can match different fields)
- Each term is processed with its own operator (quotes, !, etc.)
- Terms are combined with
ANDin SQL - Example:
"911" AND "12345"finds records with "911" in one field AND "12345" in another
- Syntax:
Search Execution Logic:
For each CDR record:
  For normal search (no !):
    - Check if ANY field contains/equals the term → Include if TRUE
    - SQL: field1 LIKE '%term%' OR field2 LIKE '%term%' OR ...

  For inverse search (!):
    - Check if ALL fields do NOT contain/equal the term → Include if TRUE
    - SQL: field1 NOT LIKE '%term%' AND field2 NOT LIKE '%term%' AND ...

  For AND searches:
    - Each term is evaluated separately
    - All term conditions must be TRUE → Include if TRUE
    - SQL: (term1_conditions) AND (term2_conditions) AND ...
Complex Search Examples:
| Query | How It Works | Result |
|---|---|---|
61480 | Contains search across all fields | All records with "61480" anywhere (caller, destination, UUID, etc.) |
"911" | Exact match across all fields | Records where any field is exactly "911" |
!NORMAL_CLEARING | Inverse contains search | Excludes records with "NORMAL_CLEARING" in ANY field (failed calls) |
!"NORMAL_CLEARING" | Exact inverse | Excludes records where any field exactly equals "NORMAL_CLEARING" |
"911" AND "12345" | Exact "911" AND exact "12345" | Records with both values (e.g., caller="12345", destination="911") |
!NORMAL AND 61480 | Inverse contains "NORMAL" AND contains "61480" | Non-normal calls involving "61480" |
!"ANSWER" AND !NORMAL | Exact inverse "ANSWER" AND inverse contains "NORMAL" | Exclude answered calls and anything with "NORMAL" |
61480 AND !NORMAL_CLEARING | Contains "61480" AND inverse contains "NORMAL_CLEARING" | Failed calls involving "61480" |
Practical Use Cases:
- Find specific number:
61480123456- Contains search finds partial matches - Find exact emergency calls:
"911"- Only calls to exactly "911" - All failed calls:
!NORMAL_CLEARING- Exclude successful calls - Specific caller's failed calls:
"61480123456" AND !NORMAL- Combine exact caller with inverse - Exclude test numbers:
!test AND !demo- Multiple inverse searches - Complex debugging:
61480 AND !"ANSWER" AND !CANCEL- Contains one term, exclude exact and partial others
Data Source
CDR data is queried directly from the TAS CDR SQLite database.
The schema may vary between deployments based on specific requirements.
CDR Export Options
Important: CDR records can be exported in various formats to support integration with billing systems, analytics platforms, and reporting tools.
The CDR database schema and export formats are deployment-specific. When setting up your system, please request the specific CDR output formats you need from your integration engineer. Common export formats include:
- CSV (Comma-Separated Values)
- JSON (for API integration)
- XML
- Direct database access
- Custom formatted exports
Your integration engineer can configure CDR export mechanisms tailored to your operational and billing requirements.
Use Cases
- Call Troubleshooting: Search for specific calls by number or UUID to debug issues
- Billing Reconciliation: Filter by date range to match billing periods
- Quality Analysis: Filter by hangup cause to identify problem patterns
- Emergency Call Auditing: Search for "911" to verify emergency call handling
- Customer Support: Look up specific customer calls by caller ID or destination
- Pattern Analysis: Sort by duration or timestamps to identify anomalies
- Compliance & Record Keeping: Date range filters for regulatory reporting
- Failed Call Analysis: Use
!NORMAL_CLEARINGto find all failed calls - Context-Based Reports: Filter by context to analyze specific call flows
Configuration
Default Visible Columns
You can configure which CDR fields are shown by default in the LiveView by setting cdrs_field_list in your config/runtime.exs:
config :tas,
  cdrs_field_list: [
    "caller_id_number",
    "destination_number",
    "start_stamp",
    "duration",
    "hangup_cause"
  ]
Behavior:
- If
cdrs_field_listis not set: All available CDR fields are shown by default - If
cdrs_field_listis set: Only the specified fields are shown by default, but all other fields remain available in the column picker - If a field in the list doesn't exist in the CDR data, it will be automatically skipped
- Field names can be specified as strings or atoms
- Users can manually select additional columns from the column picker at any time
Use Cases:
- Set a clean default view with only essential fields visible
- Reduce information overload for new users
- Standardize the initial column layout across all users
- Keep advanced fields hidden by default but still accessible
Example Configuration:
# Show only essential call information by default
cdrs_field_list: [
  "start_stamp",
  "caller_id_number",
  "destination_number",
  "duration",
  "billsec",
  "hangup_cause"
]
Note: This configuration sets the default visible columns. All CDR fields remain available in the "Columns" picker - users can manually show/hide any field they need.
Troubleshooting
No Results Found
- Check for typos in search terms
- Try removing quotes for broader search
- Verify the term exists in searchable fields
- Check date range isn't too restrictive
Too Many Results
- Add more AND terms to narrow
- Use exact match with quotes
- Apply date range filters
- Use field-specific filters
Unexpected Results
- Remember search applies to ALL searchable fields
- Check if term appears in unexpected field (like UUID)
- Use exact match to avoid partial matches
- Verify inverse logic (AND vs OR)
Tips
- Column Selection: Hide unused columns to focus on relevant data and improve performance
- Combine Filters: Use search + date range + field filter together for precise queries
- Date Range Performance: Narrow date ranges return results faster for large databases
- Sort for Analysis: Sort by duration to find long/short calls, or by timestamp to see call patterns
- Active Filter Chips: Use visual chips to verify which filters are currently active
- Persistent Settings: Column selections are saved per browser, useful for different analysis tasks
- Color Coding: Quickly scan hangup causes - green is good, red needs investigation
- Expandable Details: Click rows to see all fields without cluttering the main view
- Search Operators: Master the search syntax for powerful filtering:
- Use quotes for exact matches:
"911" - Use
!to exclude:!NORMAL_CLEARING - Combine with AND:
"61480" AND !NORMAL
- Use quotes for exact matches:
- Pagination: Remember filters persist across pages - use pagination to review large result sets
Active Calls Monitoring
The Active Calls view shows real-time information about ongoing calls through the system.
Access: Navigate to /calls in the Control Panel
Features
- Real-time Status: Live view of active call sessions
- Call Details: View channel variables and call state information
- UUID Tracking: Monitor both A-leg and B-leg call identifiers
IMS Conference Server
The IMS Conference Server provides multi-party conferencing capabilities compliant with 3GPP IMS standards (RFC 4579, RFC 4575, TS 24.147).
Access: Navigate to /conference in the Control Panel
Documentation: See IMS Conference Server User Guide for detailed documentation
Features
- Real-time Monitoring: Live view of active conferences and participants
- Conference Statistics Dashboard:
- Active conference count
- Total participants across all conferences
- Video conference count
- Locked conference count
- Server configuration details (domain, MNC/MCC, max participants)
- Conference List: View all active conferences with:
- Conference ID and SIP URI
- Current participant count
- Conference creator identity
- Conference Details: Click any conference to expand and view:
- Full conference information (state, video status, locked status, recording status)
- Complete participant list with roles and states
- Participant video status
- Conference Control Actions:
- Lock/Unlock conferences to control access
- Enable/Disable video for conferences
- Real-time status updates with action feedback
- Auto-Refresh: Configurable auto-refresh (default: 5 seconds) for real-time monitoring
OmniTAS Console Management
All conference operations are also available through the OmniTAS console using the ims_conference command:
ims_conference list                    # List all active conferences
ims_conference info <conf_id>          # Show conference details
ims_conference stats                   # Show server statistics
ims_conference lock <conf_id>          # Lock a conference
ims_conference unlock <conf_id>        # Unlock a conference
ims_conference video <conf_id> on|off  # Control video
ims_conference record <conf_id> start|stop  # Control recording
ims_conference add <conf_id> <sip_uri>     # Add participant
ims_conference remove <conf_id> <uuid>     # Remove participant
ims_conference destroy <conf_id>       # Terminate conference
Use Cases
- Operational Monitoring: Real-time visibility into active conferences and resource usage
- Capacity Management: Monitor participant counts and video usage to manage bandwidth
- Troubleshooting: Diagnose conference access issues, participant connection problems
- Conference Control: Lock conferences for privacy, manage video to control bandwidth
- Compliance: Monitor and record conferences for regulatory compliance
3GPP Compliance
The conference server implements key 3GPP IMS conferencing specifications:
- TS 24.147: Conferencing using IM Core Network subsystem
- RFC 4579: SIP Call Control - Conferencing for User Agents
- RFC 4575: SIP Event Package for Conference State
- RFC 5239: Framework for Centralized Conferencing
Gateway Status
Monitor the status and health of SIP gateways/trunks connected to the TAS.
Access: Navigate to /gw in the Control Panel
Features
- Registration Status: View gateway registration state
- Call Statistics: Track incoming/outgoing calls and failures
- Ping Monitoring: SIP OPTIONS ping times and reachability
- Gateway Details: Complete configuration and status information
Monitored Metrics
- SIP Registration status
- Ping time (average SIP OPTIONS response time)
- Uptime (seconds since profile restart)
- Calls In / Calls Out
- Failed Calls In / Failed Calls Out
- Last ping time and frequency
Diameter Peer Status
Monitor Diameter peer connectivity for Sh and Ro interfaces.
Access: Navigate to /diameter in the Control Panel
Features
- Peer Status: Connection state for each configured peer
- Application Support: View supported Diameter applications (Sh, Ro)
- Watchdog Status: Diameter watchdog monitoring
System Logs Viewer
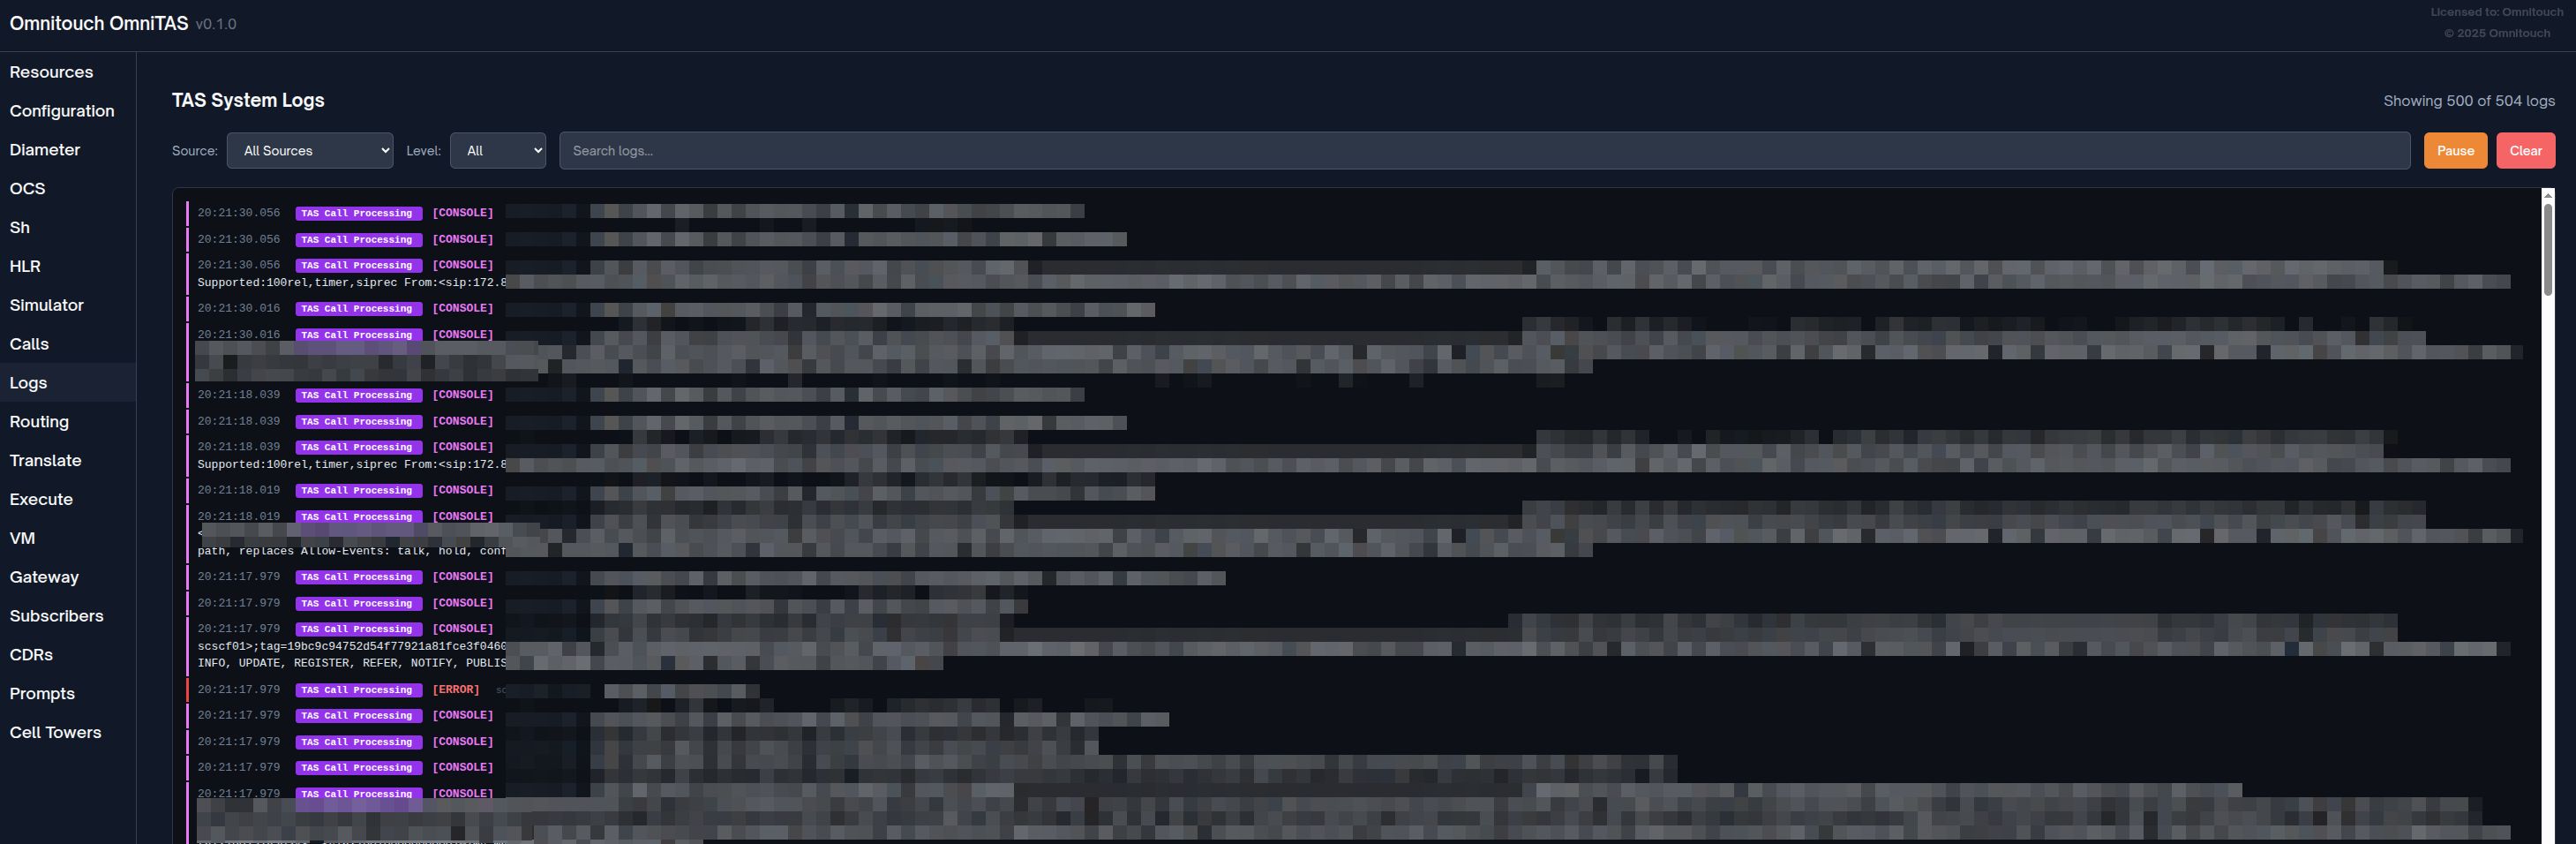
Real-time unified log viewer for both TAS Backend (Elixir) and TAS Call Processing (FreeSWITCH) logs.
Access: Navigate to /logs in the Control Panel
Features
- Unified Log Stream: View logs from both TAS Backend and Call Processing in one interface
- Real-time Updates: Live streaming of log messages as they occur (auto-refresh every 1 second)
- Color-Coded Log Levels:
- 🟣 Console - Console messages (purple/magenta)
- 🔴 Alert/Critical - Urgent issues requiring immediate attention (red)
- 🟠 Error - Error conditions (light red)
- 🟡 Warning - Warning messages (yellow)
- 🔵 Notice - Notable informational messages (cyan)
- 🔵 Info - General informational messages (blue)
- ⚪ Debug - Debug/verbose logging (gray)
- Source Badges:
- 🔵 TAS Backend - Elixir application logs (blue badge)
- 🟣 TAS Call Processing - FreeSWITCH logs (purple badge)
- Left Border Indicators: Color-coded left border matching log level for quick visual scanning
- Multiple Filters:
- Source Filter: All Sources / TAS Backend / TAS Call Processing
- Level Filter: All / Console / Alert / Critical / Error / Warning / Notice / Info / Debug
- Text Search: Real-time keyword search across log messages
- Pause/Resume: Freeze log streaming to analyze specific entries without losing context
- Clear Logs: Remove all current log entries from display
- Log Counter: Shows filtered logs vs total logs (e.g., "Showing 150 of 500 logs")
- Tail Behavior: Maintains last 500 log entries for performance
- Metadata Display: File name and line number for source code references (when available)
- Scrollable View: Fixed-height container with auto-scroll for latest logs
How to Use
-
Basic Viewing:
- Page loads with latest 500 log entries from both sources
- Logs appear in real-time as they're generated
- Most recent logs appear at the top
- Auto-refreshes every 1 second
-
Filter by Source:
- Select from "Source" dropdown:
- All Sources - Show both TAS Backend and Call Processing logs
- TAS Backend - Only Elixir application logs
- TAS Call Processing - Only FreeSWITCH/dialplan logs
- Filter applies immediately
- Select from "Source" dropdown:
-
Filter by Log Level:
- Select from "Level" dropdown:
- All - Show all log levels
- Console through Debug - Show only that specific level
- Useful for focusing on errors or debugging specific issues
- Select from "Level" dropdown:
-
Search for Keywords:
- Type in the "Search logs..." box
- Case-insensitive search across log messages
- Filters in real-time as you type
- Combines with source and level filters
-
Pause/Resume Stream:
- Click "Pause" button (orange) to freeze log updates
- "PAUSED" indicator appears in header
- Review specific log entries without new logs interrupting
- Click "Resume" button (green) to restart live streaming
-
Clear Logs:
- Click "Clear" button (red) to remove all displayed logs
- Clears both TAS Backend and Call Processing logs
- Fresh logs will appear as they're generated
-
Read Log Entries:
- Timestamp: Shows time in HH:MM:SS.milliseconds format
- Source Badge: Indicates TAS Backend (blue) or Call Processing (purple)
- Log Level: Color-coded level in brackets [ERROR], [INFO], etc.
- File/Line: Source code location (when available)
- Message: The actual log message content
Log Levels Explained
| Level | Color | When Used | Example |
|---|---|---|---|
| Console | Purple | Console-specific messages | High-priority FreeSWITCH console output |
| Alert | Red | Immediate action required | System component failure |
| Critical | Red | Critical conditions | Database connection lost |
| Error | Light Red | Error conditions | Failed to process call, invalid configuration |
| Warning | Yellow | Warning conditions | Deprecated function used, retry attempt |
| Notice | Cyan | Notable normal events | Configuration reloaded, service started |
| Info | Blue | Informational messages | Call connected, Diameter request sent |
| Debug | Gray | Debug-level messages | Function entry/exit, variable values |
Use Cases
- Real-time Troubleshooting: Monitor logs during active call to debug issues
- Error Investigation: Filter by Error/Critical levels to find problems
- Call Flow Analysis: Search for Call-ID or phone number to trace call path
- Performance Monitoring: Watch for warnings and errors during load testing
- Integration Debugging: Filter TAS Backend to see Diameter/Sh/Ro messages
- Dialplan Debugging: Filter TAS Call Processing to see FreeSWITCH call routing
- System Health Monitoring: Keep logs open to watch for anomalies
- Development & Testing: Use Debug level to see verbose application behavior
Tips
- Combine Filters: Use Source + Level + Search together for precise filtering
- Example: Source="TAS Backend" + Level="Error" + Search="Diameter" → Find Diameter errors
- Pause Before Searching: Pause stream before typing search query to avoid logs scrolling
- Use Debug Wisely: Debug level is verbose - filter to specific source to reduce noise
- Color Scanning: Quickly scan left borders - red borders indicate problems
- Source Badges: Blue badges (Backend) for app logic, Purple badges (Call Processing) for calls
- Timestamp Precision: Millisecond timestamps help correlate events across systems
- File References: Click/note file:line references to jump to source code
- Clear Regularly: Clear logs when switching investigation contexts for clarity
- Search for UUIDs: Search for Call-ID/UUID to follow a specific call through entire system
- Emergency Search: Search "911" or "emergency" to quickly find emergency call handling
Technical Details
- Log Limit: Maximum 500 logs displayed (oldest discarded when limit reached)
- Refresh Rate: Auto-refresh every 1000ms (1 second)
- Search: Case-insensitive substring matching on message field only
- Empty Filtering: Automatically filters out empty/placeholder log messages
- Source Detection: Logs tagged with
:elixiror:freeswitchsource - Sorting: Logs sorted by timestamp descending (newest first)
- PubSub: Elixir logs delivered via Phoenix PubSub for real-time updates
- FreeSWITCH Logs: Collected via Event Socket Interface (ESI) log listener
Cell Tower Database
Manage and query the OpenCellID cell tower location database for emergency services and location-based features.
Access: Navigate to /cell_towers in the Control Panel
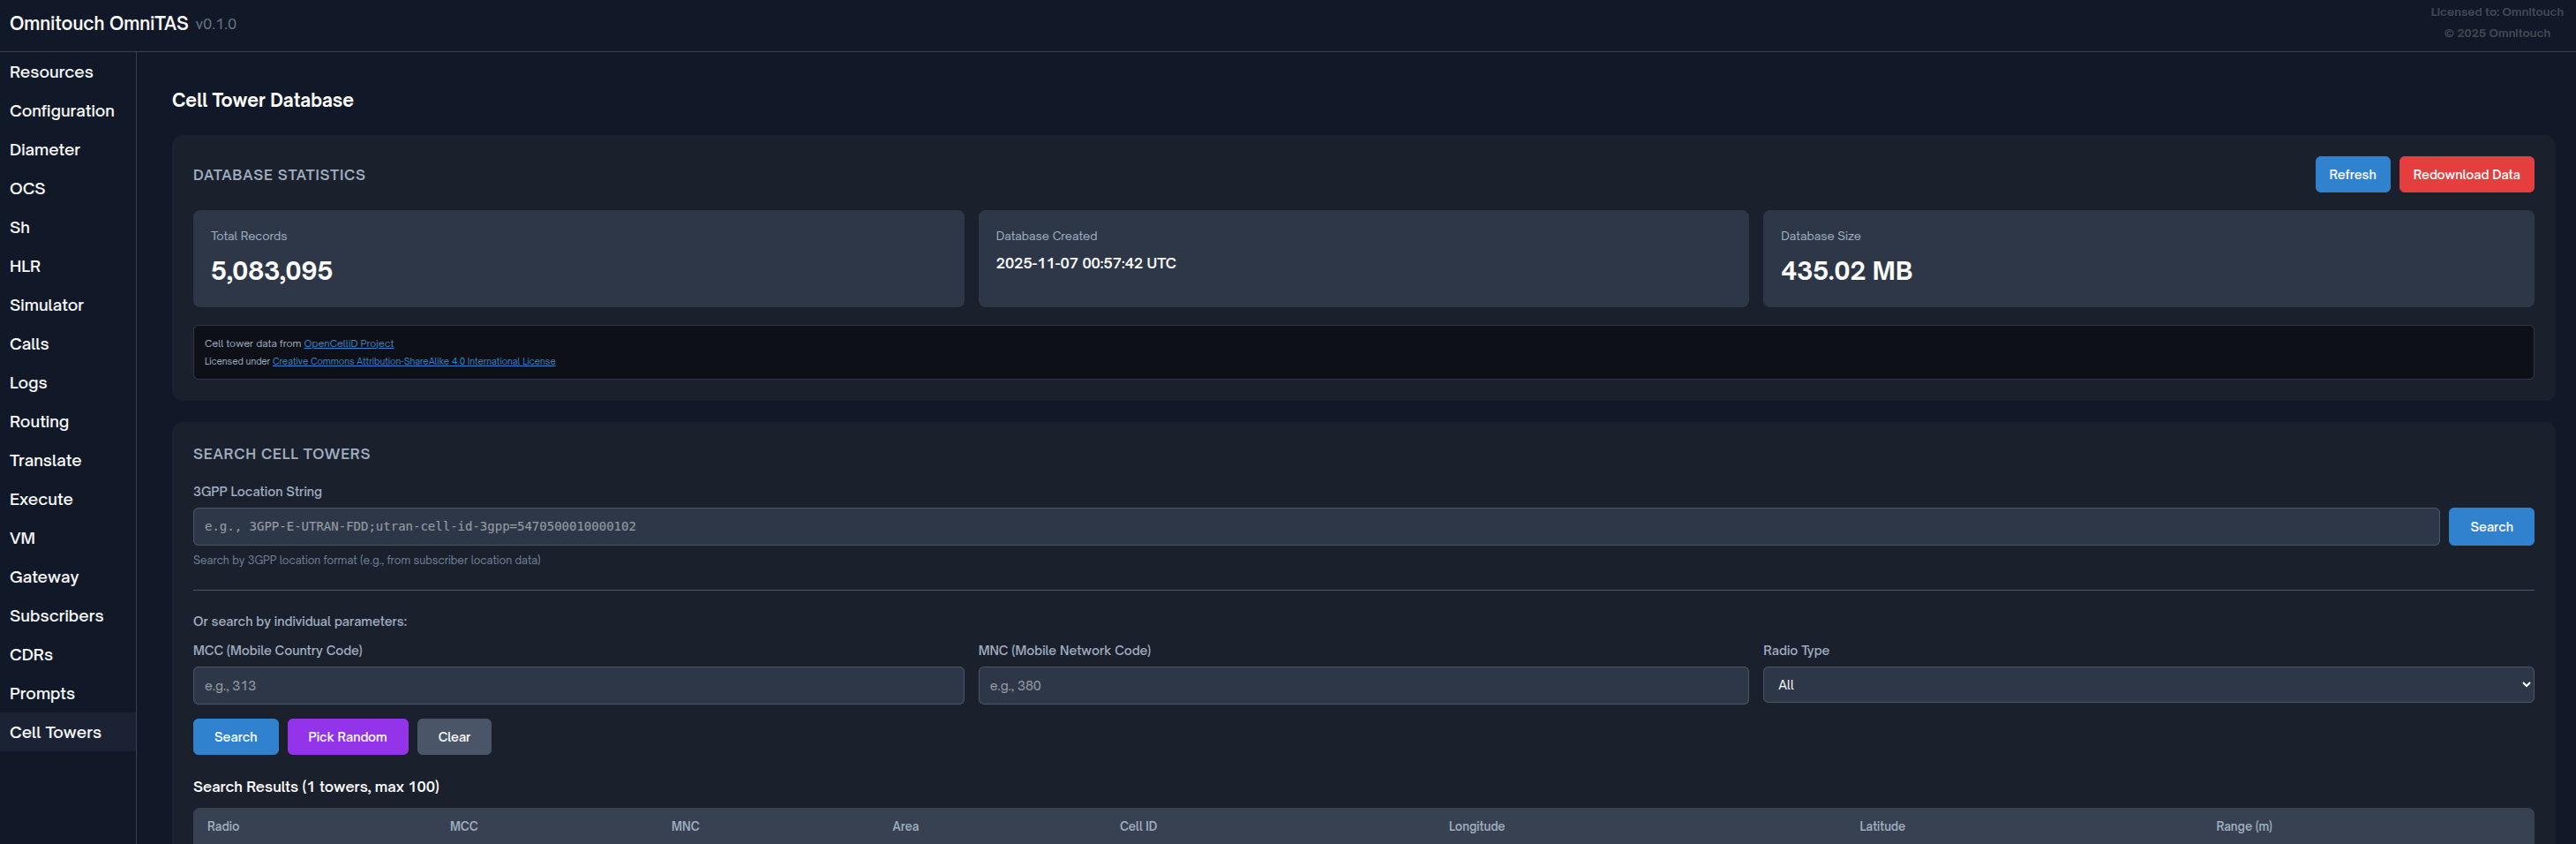
Features
- Database Statistics: View total records, coverage by country/network
- Search & Query:
- Search by MCC (Mobile Country Code)
- Search by MNC (Mobile Network Code)
- Search by radio type (GSM, UMTS, LTE)
- Search by location string
- Database Management:
- Import cell tower data
- Re-download latest dataset from OpenCellID
- View import status and progress
- Location Resolution: Resolve cell IDs to geographic coordinates
Use Cases
- Emergency call location determination
- Subscriber location tracking (with consent)
- Network coverage analysis
- Troubleshooting roaming location issues
- Cell tower database maintenance
Data Source
Cell tower data is sourced from OpenCellID (https://opencellid.org/), a collaborative community project to create a free database of cell tower locations worldwide.
Call Simulator
Interactive call simulation tool for testing dialplan logic without making real calls.
Access: Navigate to /simulator in the Control Panel
Detailed Documentation: See HLR and Call Simulator Guide
Features
- Simulate Call Types: Test MO, MT, and Emergency calls
- Configurable Parameters:
- Source and destination numbers
- Source IP address (to simulate SBC/CSCF)
- Force specific call disposition
- Skip OCS authorization for faster testing
- Comprehensive Results:
- Complete dialplan variable output
- Sh/HLR lookup results
- OCS authorization result
- SS7 MAP query results (if applicable)
- Generated dialplan XML
- Step-by-Step Processing: View each stage of call processing
Use Cases
- Test dialplan changes before deployment
- Verify subscriber provisioning
- Debug call routing issues
- Train staff on call flow
- Validate OCS/HLR integration
- Test emergency call handling
HLR/MAP Testing
Test SS7 MAP operations including Send Routing Info (SRI) and Provide Roaming Number (PRN) queries.
Access: Navigate to /hlr in the Control Panel
Detailed Documentation: See HLR and Call Simulator Guide
Features
- SRI Query: Test Send Routing Info for call routing
- PRN Query: Test Provide Roaming Number for roaming subscribers
- Real Results: Actual queries to configured MAP gateway
- Response Display: View MSRN, MSC address, and forwarding status
- Error Handling: Clear display of MAP errors and timeouts
Use Cases
- Verify HLR connectivity
- Test roaming number allocation
- Debug call routing to roaming subscribers
- Validate MAP gateway configuration
- Troubleshoot call forwarding issues
OCS Testing
Test Diameter Ro (Online Charging) Credit-Control-Request (CCR) operations directly against your OCS.
Access: Navigate to /ocs_test in the Control Panel
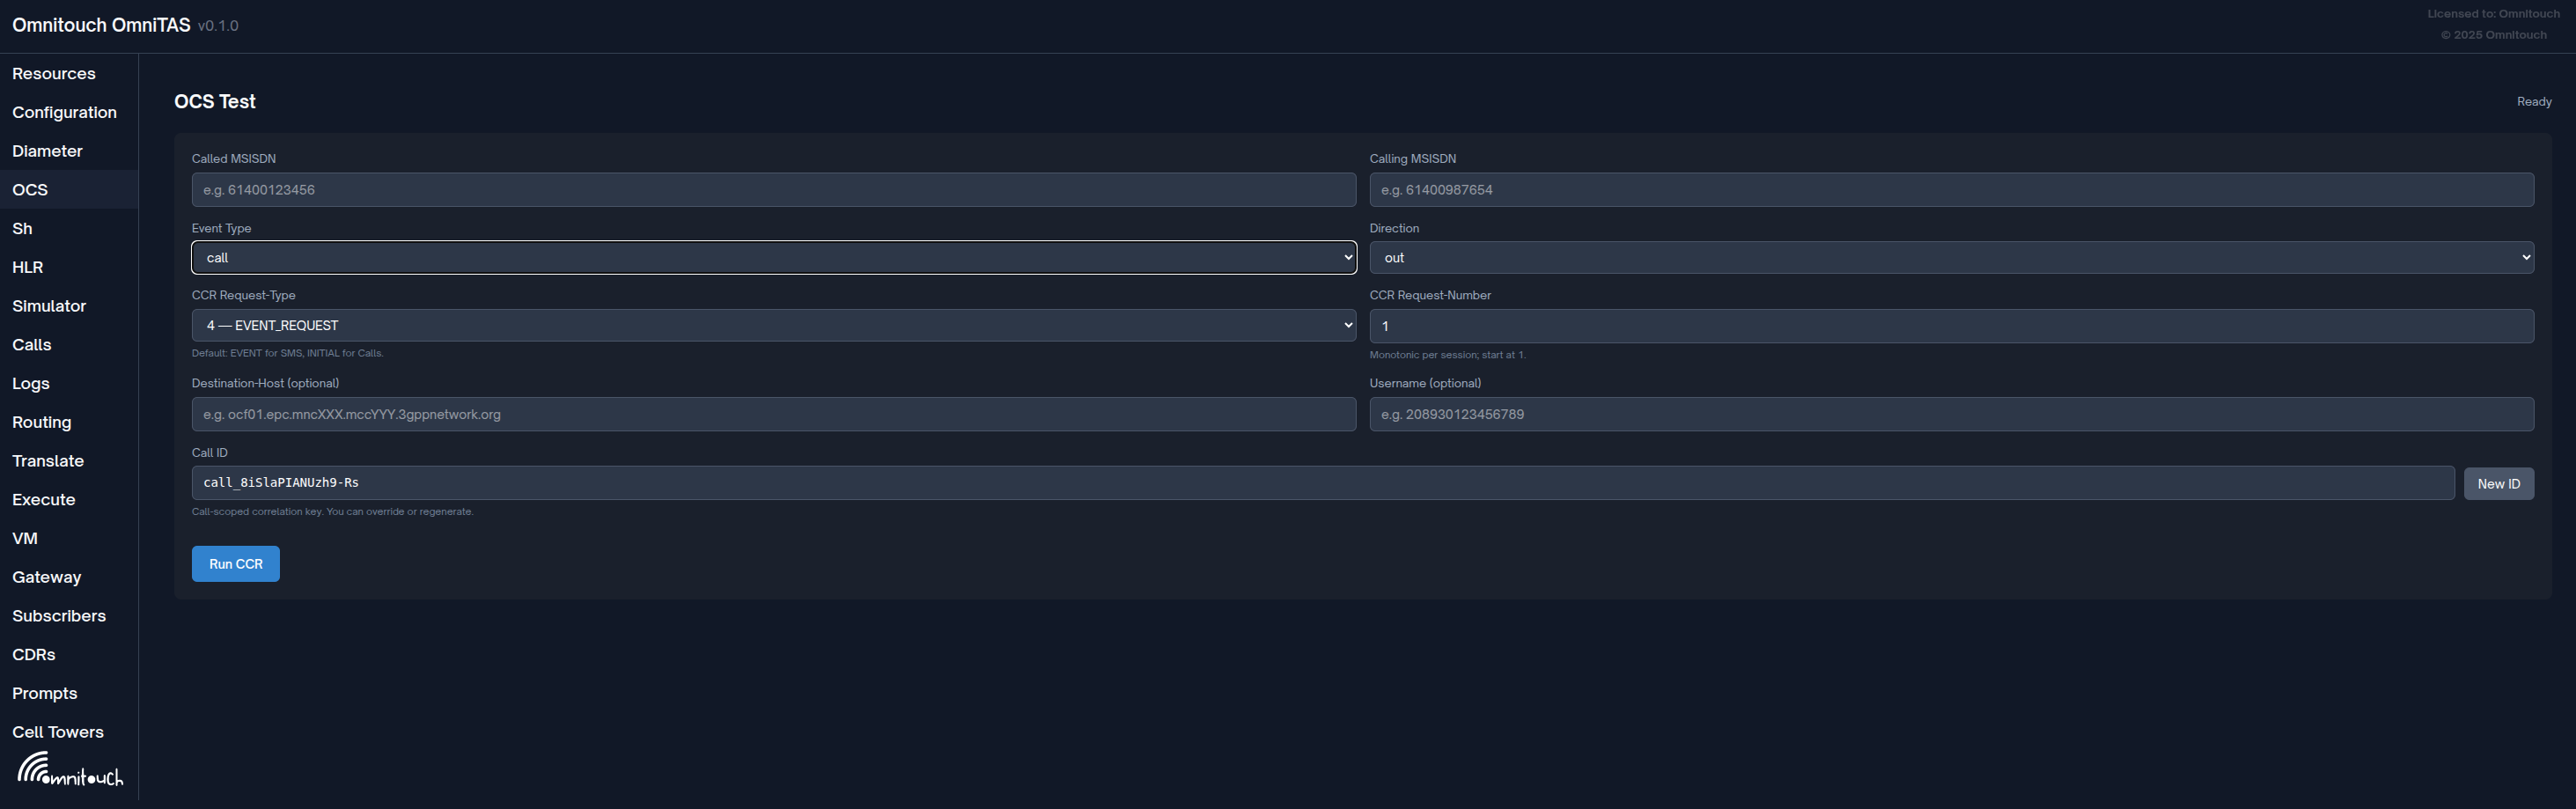
Features
- Flexible CCR Types: Send INITIAL, UPDATE, TERMINATION, or EVENT requests
- Session Simulation: Reuse the same Call ID to simulate a complete session lifecycle
- Event Type Selection: Test both SMS (event-based) and Call (session-based) charging
- Direction Control: Test both outgoing (MO) and incoming (MT) scenarios
- Optional Parameters: Specify Destination-Host and Username for advanced testing
- Real-time Results: View complete CCA (Credit-Control-Answer) responses
How to Use
-
Enter Test Parameters:
- Called MSISDN: The destination number (e.g.,
61400123456) - Calling MSISDN: The originating number (e.g.,
61400987654) - Event Type: Choose
smsorcall- SMS defaults to EVENT_REQUEST (type 4)
- Call defaults to INITIAL_REQUEST (type 1)
- Direction:
outfor MO orinfor MT
- Called MSISDN: The destination number (e.g.,
-
Configure CCR Type:
- Request-Type: Select the CCR type:
1 — INITIAL_REQUEST- Start a new session2 — UPDATE_REQUEST- Mid-session re-authorization3 — TERMINATION_REQUEST- End session and report usage4 — EVENT_REQUEST- One-time event (SMS, immediate event)
- Request-Number: Starts at 1, increment for each request in the same session
- Request-Type: Select the CCR type:
-
Session Testing:
- Call ID: Auto-generated unique identifier for correlation
- Click "New ID" to generate a fresh Call ID for a new test session
- Keep the same Call ID to simulate a complete session:
- First request: INITIAL_REQUEST (type 1, number 1)
- Mid-session: UPDATE_REQUEST (type 2, number 2, 3, 4...)
- Final request: TERMINATION_REQUEST (type 3, number N+1)
-
Advanced Options:
- Destination-Host: Target a specific OCS node (optional)
- Username: Override the subscriber identifier (optional)
-
Run and Review:
- Click "Run CCR" to send the request
- View the complete CCA response with all AVPs
- Check result code, granted units, and validity time
- Last run timestamp shown in top-right corner
Use Cases
- OCS Connectivity Testing: Verify Diameter Ro connection and authentication
- Credit Control Logic: Test credit allocation, consumption, and exhaustion scenarios
- Session Flow Testing: Simulate complete call lifecycle (INITIAL → UPDATE → TERMINATION)
- Rating Validation: Verify correct charging rates for different number ranges
- Failover Testing: Test OCS redundancy by targeting specific Destination-Host
- Integration Debugging: Troubleshoot OCS integration issues with detailed AVP inspection
- Load Testing Preparation: Validate OCS behavior before load testing
- Emergency Number Bypass: Verify that emergency numbers bypass charging correctly
Tips
- Use the same Call ID with incrementing Request-Numbers to test session continuity
- Monitor OCS logs simultaneously to correlate test requests
- Test UPDATE requests to verify mid-session re-authorization logic
- Verify that TERMINATION requests properly close sessions and prevent leaks
- Test credit exhaustion by sending UPDATE requests after consuming granted units
Sh Interface Testing
Test Diameter Sh User-Data-Request (UDR) operations to retrieve subscriber profile data from the HSS.
Access: Navigate to /sh_test in the Control Panel
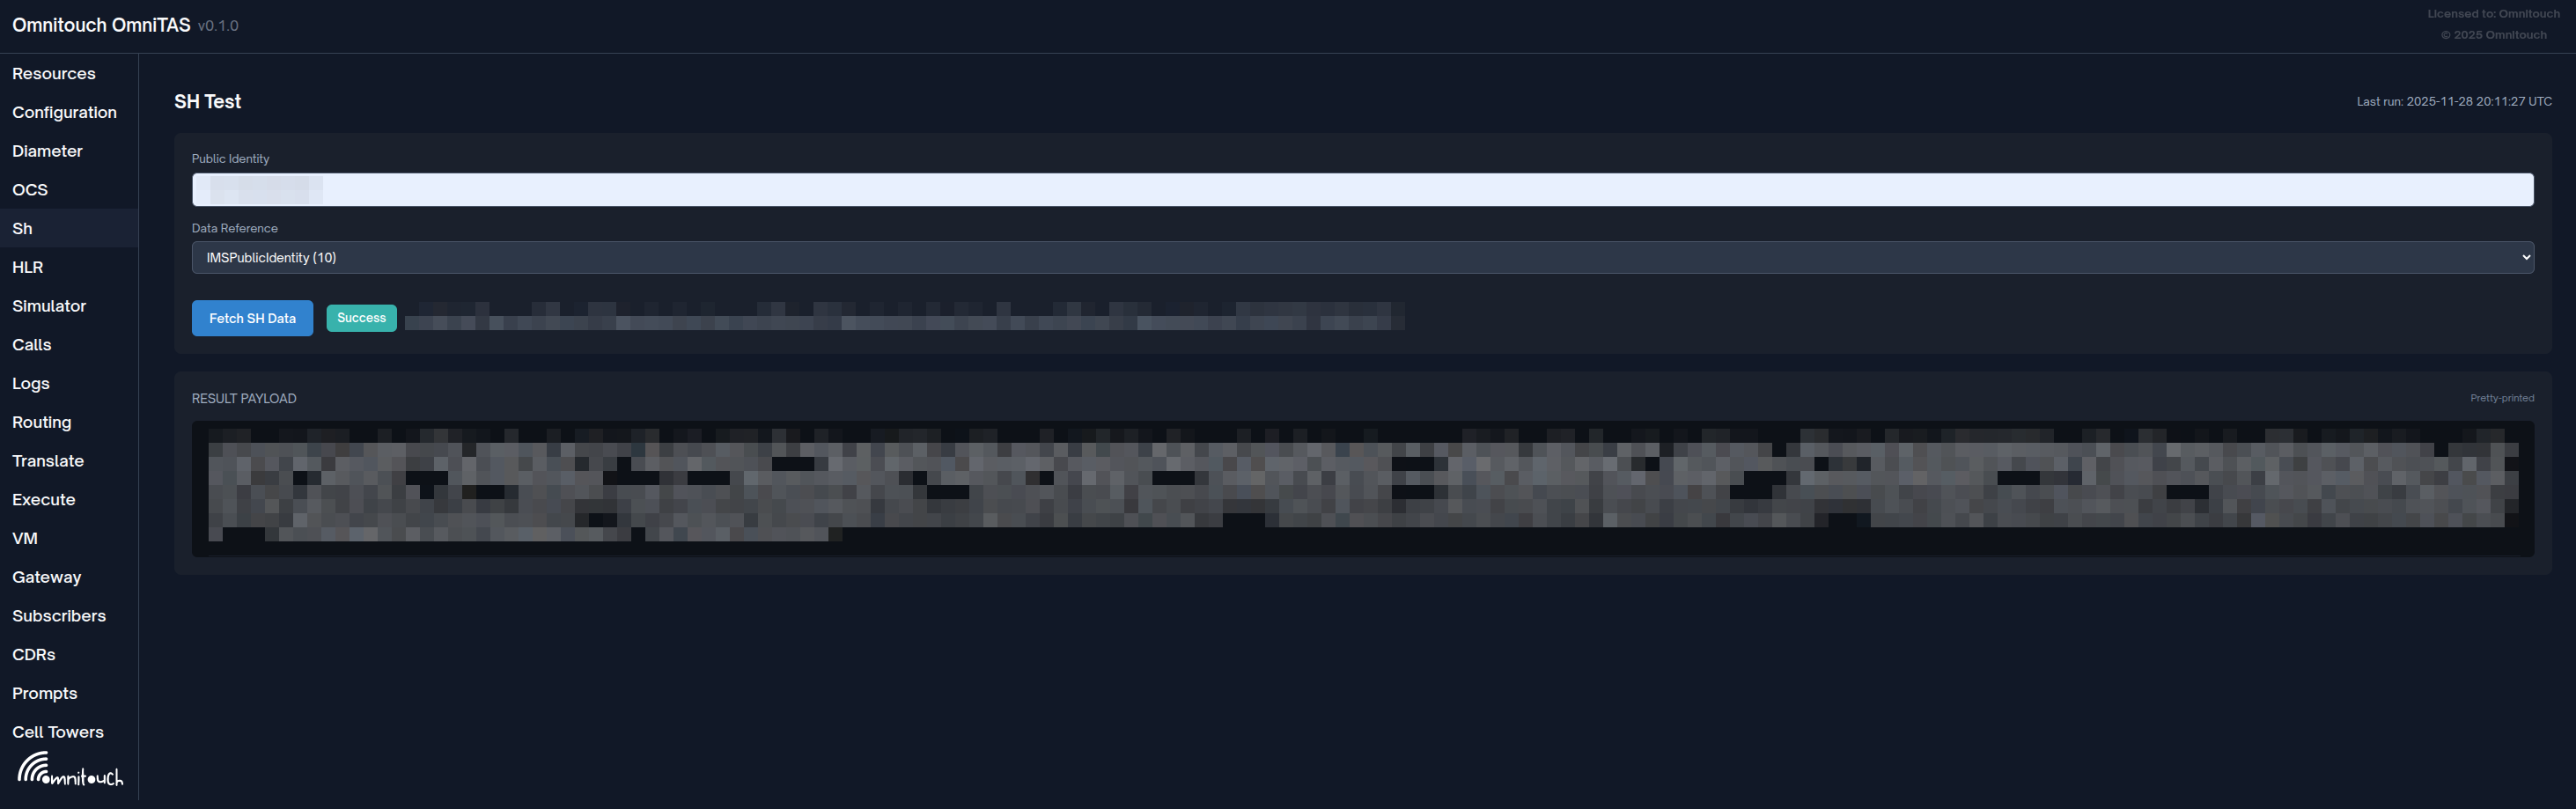
Features
- Multiple Data References: Query over 20 different subscriber data types
- Real HSS Queries: Live Diameter Sh requests to your configured HSS
- Complete Response Display: View full XML subscriber data and AVPs
- Session Tracking: Shows HSS hostname, realm, and session ID
- Error Handling: Clear display of Diameter result codes and error conditions
How to Use
-
Enter Public Identity:
- Public Identity: The subscriber's IMS Public Identity
- Format:
sip:61400123456@ims.mncXXX.mccXXX.3gppnetwork.org - Can also use
tel:+61400123456format
-
Select Data Reference: Choose the type of subscriber data to retrieve:
- RepositoryData (0): Complete subscriber profile
- IMSPublicIdentity (10): List of public identities
- IMSUserState (11): Registration state
- S-CSCFName (12): Assigned S-CSCF
- InitialFilterCriteria (13): iFC triggers for application servers
- LocationInformation (14): Current location
- ChargingInformation (16): P-Charging addresses
- MSISDN (17): Phone number
- IMSI (32): International Mobile Subscriber Identity
- IMSPrivateUserIdentity (33): Private user identity
- And many more...
-
Run and Review:
- Click "Fetch SH Data" to send the UDR request
- View the complete User-Data-Answer (UDA) response
- Check subscriber profile XML, service data, and iFC rules
- Session metadata shows which HSS responded
Use Cases
- Subscriber Verification: Confirm subscriber is provisioned in HSS
- iFC Debugging: Review Initial Filter Criteria and trigger points
- Registration Troubleshooting: Check user state and S-CSCF assignment
- Charging Configuration: Verify P-Charging-Function-Addresses
- HSS Connectivity Testing: Validate Diameter Sh connection
- Profile Validation: Ensure correct service profile is assigned
- Integration Testing: Test HSS integration after provisioning changes
- Roaming Analysis: Check location information and serving network
Tips
- Use IMSPublicIdentity (10) to see all aliases for a subscriber
- Use RepositoryData (0) to get the complete subscriber profile in one query
- Check IMSUserState (11) to verify if a subscriber is registered
- InitialFilterCriteria (13) shows which application servers will be triggered
- The session ID can be used to correlate queries in HSS logs
- Error responses include Diameter result codes (e.g., 5001 = User Unknown)
Number Translation Testing
Test number translation rules and formatting without making actual calls.
Access: Navigate to /translate in the Control Panel
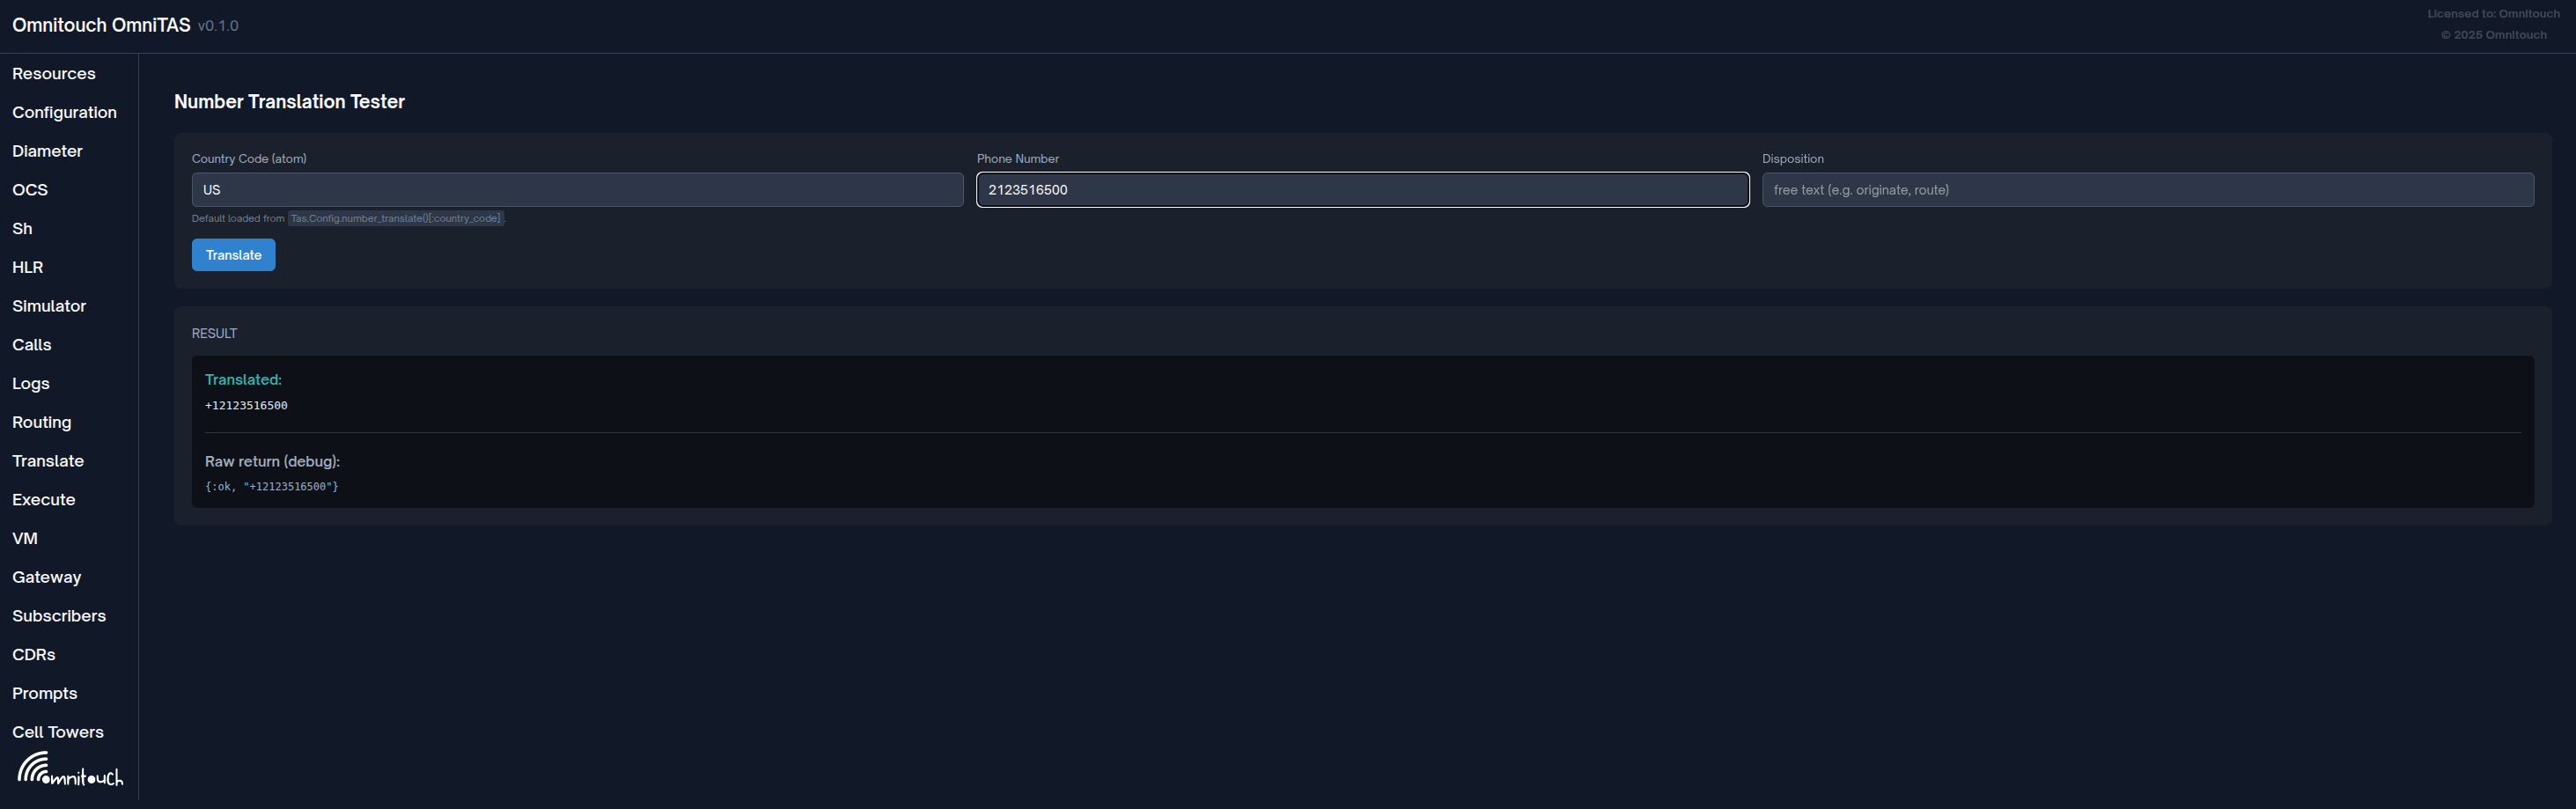
Features
- Real-time Translation: Auto-translates as you type
- Country Code Support: Test different country code contexts
- Disposition-Aware: Apply different rules based on call disposition
- Live Results: Immediate feedback with translated number
- Debug Information: View raw return values for troubleshooting
How to Use
-
Configure Parameters:
- Country Code: The dialing context (e.g.,
AU,US,NZ)- Defaults to the configured country code in
config/runtime.exs - Accepts formats:
AU,:AU,au
- Defaults to the configured country code in
- Phone Number: The number to translate
- Examples:
+61400111222,0400111222,61400111222
- Examples:
- Disposition: (Optional) Call context for conditional rules
- Examples:
originate,route,emergency
- Examples:
- Country Code: The dialing context (e.g.,
-
Test Translation:
- Enter values in the form
- Translation runs automatically as you type
- Or click "Translate" to manually trigger
- View the translated result immediately
-
Review Results:
- Translated: Shows the formatted output number
- Error: Displays validation errors or translation failures
- Raw return (debug): Shows the complete Elixir tuple for debugging
Use Cases
- Dialplan Development: Test number formatting rules before deployment
- Format Validation: Verify E.164 conversion is working correctly
- Country Code Testing: Ensure correct handling of international prefixes
- Emergency Number Detection: Verify emergency numbers are properly identified
- Short Code Handling: Test special service codes (voicemail, etc.)
- Trunk Preparation: Format numbers correctly for SIP trunk requirements
- Disposition Logic: Test different rules for MO vs MT scenarios
- Debugging Translation Issues: Troubleshoot why specific numbers fail routing
Tips
- Test both local format (
0400111222) and international format (+61400111222) - Verify emergency numbers (
000,112) are detected correctly - Use disposition field to test different call scenarios (MO, MT, emergency)
- Check that short codes and internal numbers are handled appropriately
- The debug output shows the raw return value - useful for investigating issues
- Test edge cases like leading zeros, international prefixes, and special characters
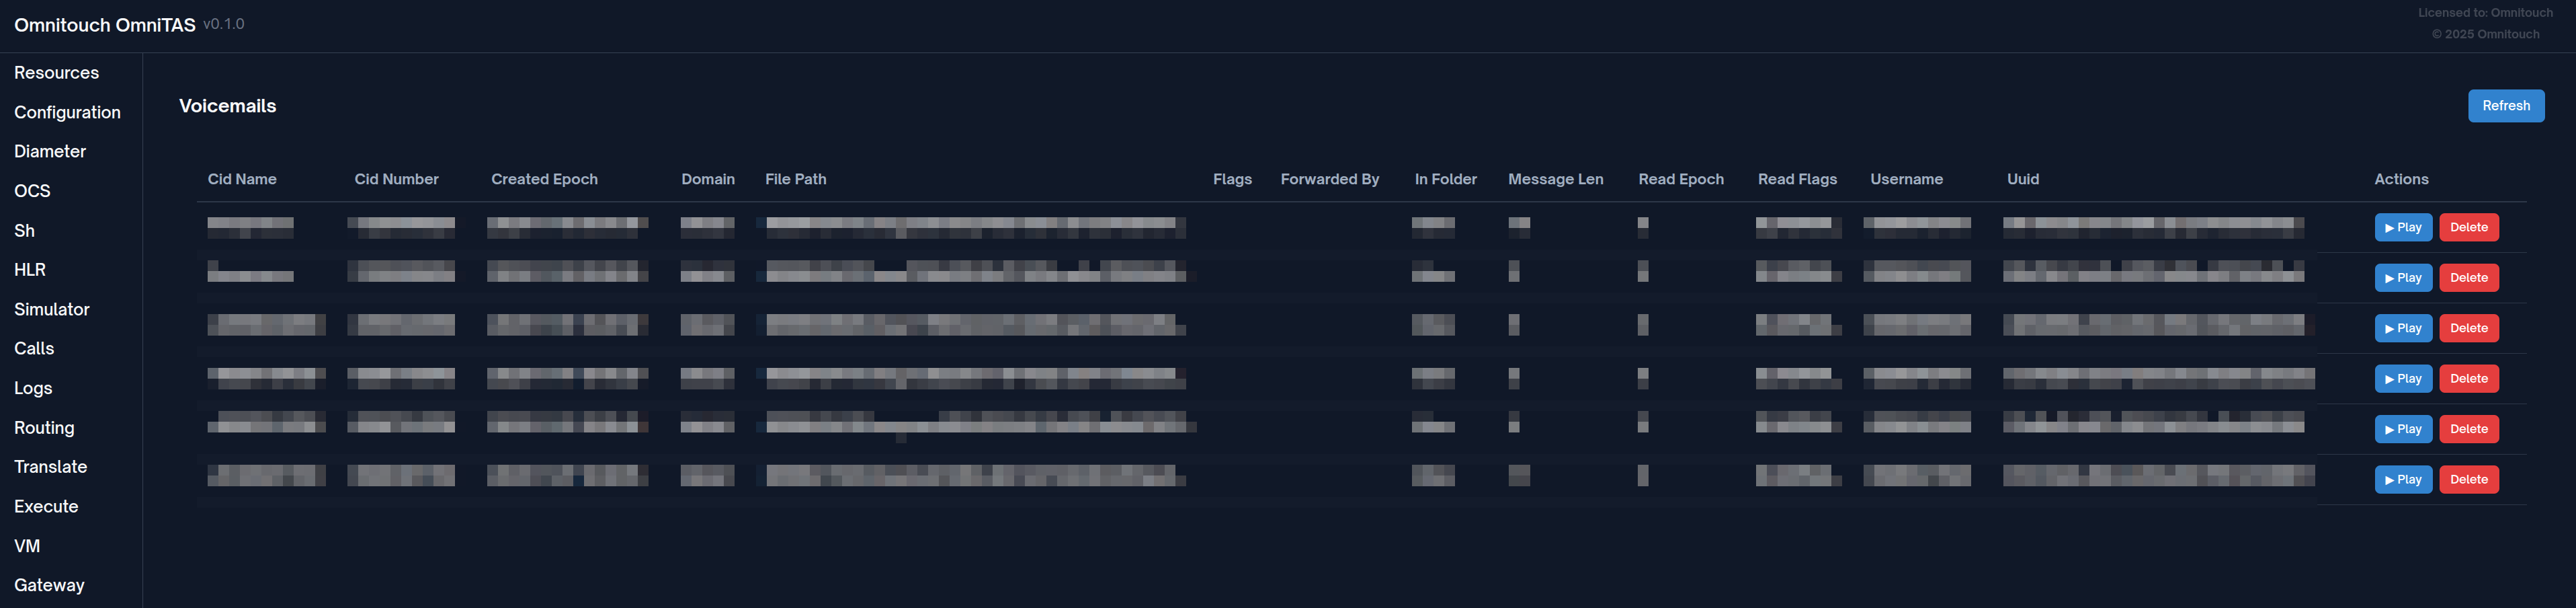
Voicemail Management
Manage and listen to voicemail messages stored in the system.
Access: Navigate to /voicemail in the Control Panel
Features
- Complete Voicemail List: View all voicemail messages across all mailboxes
- In-Browser Playback: Listen to voicemail recordings directly in the web interface
- Message Details: View username, UUID, timestamps, file paths, and metadata
- Delete Functionality: Remove individual voicemail messages
- Auto-Refresh: Refresh button to reload latest voicemail data
- Dynamic Columns: Automatically displays all available database fields
How to Use
-
View Voicemail List:
- Page loads automatically with all voicemail records
- Table shows all fields from the voicemail database
- Timestamps are automatically formatted from epoch values
- File paths are shortened for readability
-
Listen to Messages:
- Click "▶ Play" button next to any voicemail
- Audio player appears with controls (play, pause, seek, volume)
- Supports WAV, MP3, and OGG formats
- Click "Stop" to close the audio player
-
Delete Messages:
- Click "Delete" button to remove a voicemail
- Confirmation prompt prevents accidental deletion
- Page automatically refreshes after successful deletion
-
Refresh Data:
- Click "Refresh" button in top-right to reload voicemail list
- Useful after new voicemails are left
Message Details Displayed
The table dynamically shows all available fields, typically including:
- Username: Mailbox owner
- UUID: Unique message identifier
- Created Epoch: When the message was left (auto-formatted to readable date/time)
- Read Epoch: When the message was accessed (if applicable)
- File Path: Location of the audio file
- Additional metadata from the voicemail database
Use Cases
- Subscriber Support: Listen to voicemail messages for troubleshooting
- Testing Voicemail Delivery: Verify voicemails are being stored correctly
- Message Management: Clean up old or test voicemail messages
- Troubleshooting Recording Issues: Check file paths and verify audio files exist
- Mailbox Maintenance: Monitor voicemail storage and usage
- Quality Assurance: Review recorded messages for audio quality
Tips
- File paths are automatically shortened to show only the relevant portion
- Epoch timestamps are automatically converted to human-readable format
- Empty voicemail database shows "No voicemail records found"
- Audio playback uses HTML5 audio element - supported in all modern browsers
- Delete confirmation prevents accidental removal of important messages
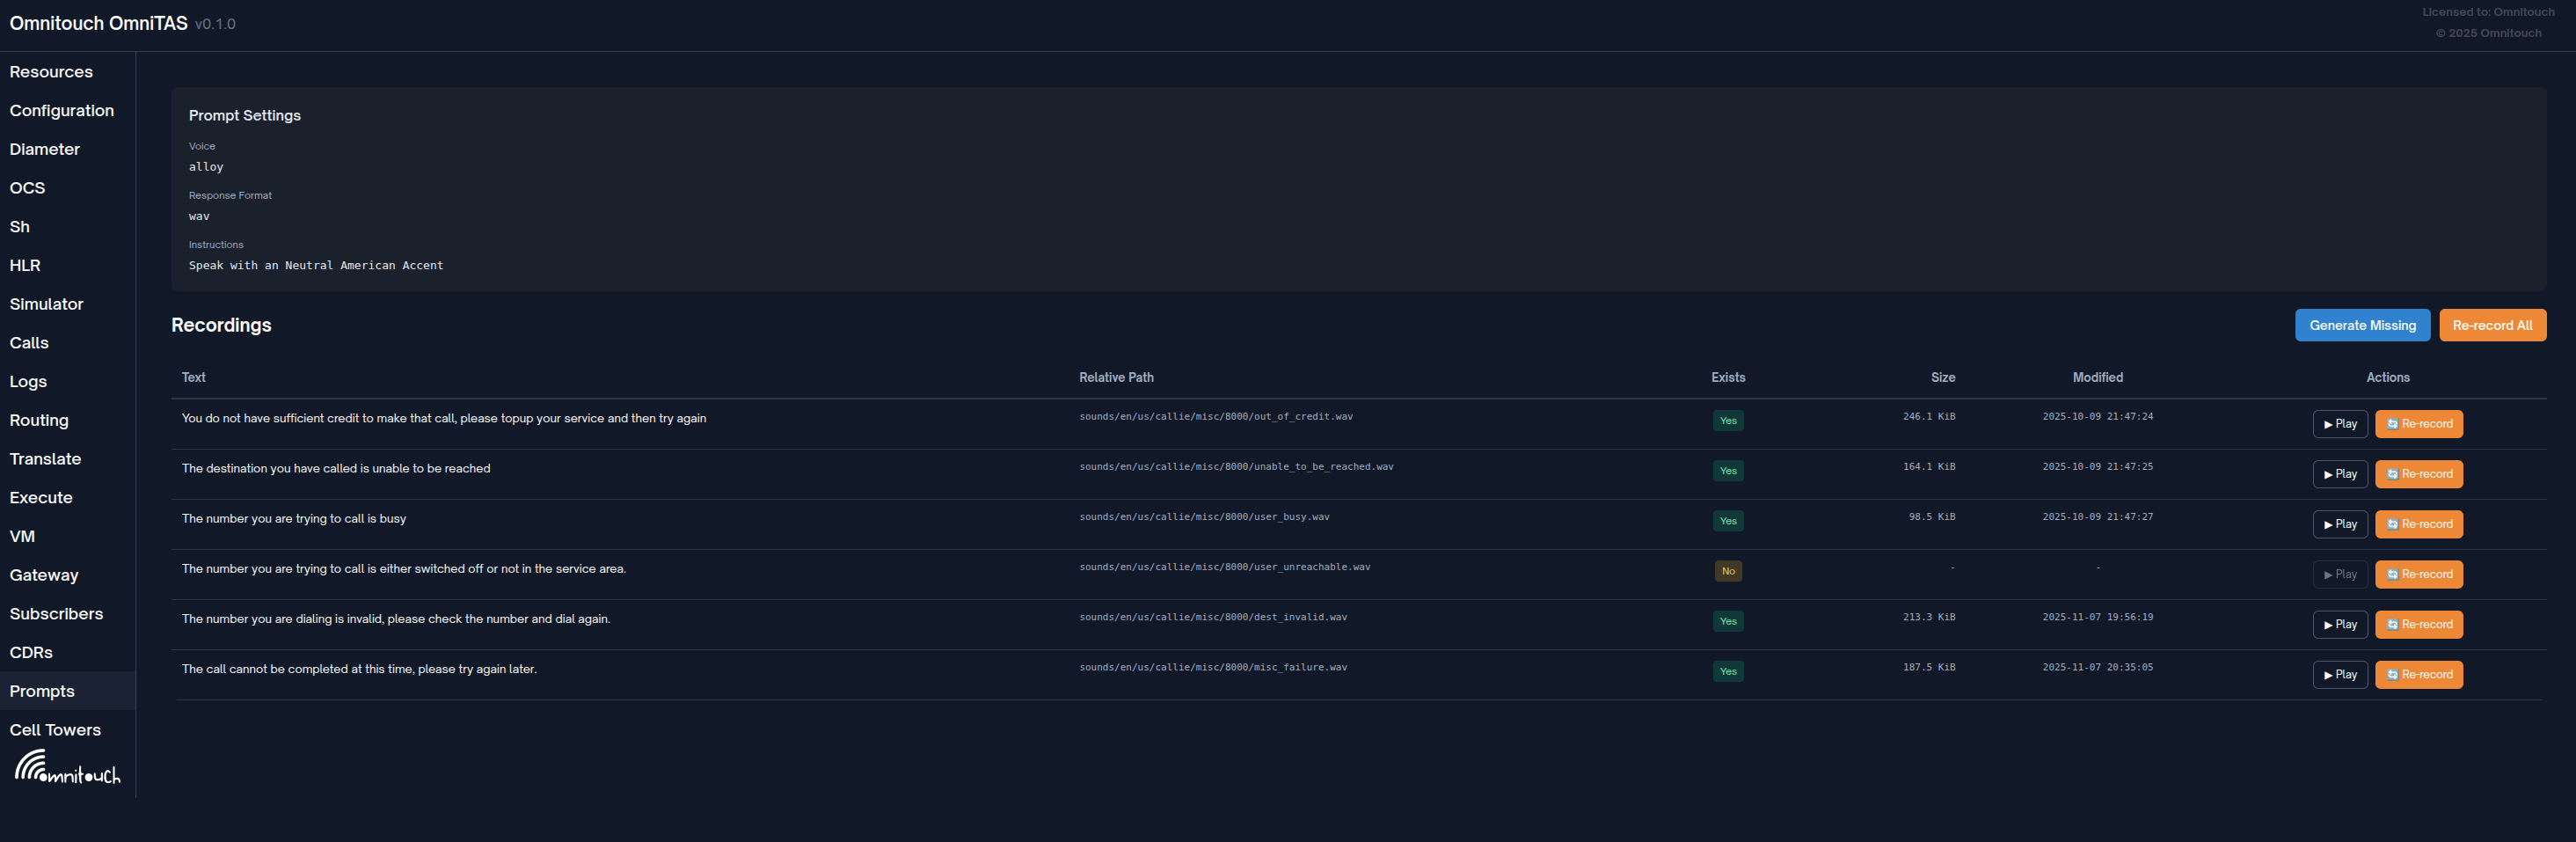
TTS Prompt Management
Manage Text-to-Speech (TTS) generated audio prompts used throughout the system.
Access: Navigate to /prompts in the Control Panel
Features
- Prompt Settings Display: View current TTS voice, response format, and instructions
- Recording Status: See which prompts exist and which are missing
- File Details: View file size, modification time, and path for each prompt
- In-Browser Playback: Listen to prompts directly in the web interface
- Generate Missing: Automatically create all missing prompt files
- Re-record Individual: Regenerate a specific prompt with updated settings
- Re-record All: Regenerate all prompts (useful after changing voice or settings)
How to Use
-
Review Prompt Settings:
- Voice: TTS voice being used (e.g.,
alloy,nova,shimmer) - Response Format: Audio format (e.g.,
wav,mp3,opus) - Instructions: Special instructions passed to TTS engine
- Voice: TTS voice being used (e.g.,
-
Check Recording Status:
- Text: The prompt text to be spoken
- Relative Path: Where the audio file is stored
- Exists: Green "Yes" if file exists, Yellow "No" if missing
- Size: File size in bytes/KiB/MiB
- Modified: Last modification timestamp
-
Generate Prompts:
- Generate Missing: Creates only prompts that don't exist yet
- Useful for initial setup or after adding new prompts
- Re-record All: Regenerates all prompts regardless of existence
- Useful after changing voice, format, or instructions
- Use with caution as it regenerates everything
- Generate Missing: Creates only prompts that don't exist yet
-
Manage Individual Prompts:
- ▶ Play: Listen to the prompt (only enabled if file exists)
- 🔄 Re-record: Regenerate just this one prompt
- Useful if one prompt sounds incorrect
- Uses current voice and settings
-
Listen to Prompts:
- Click "▶ Play" to hear the prompt
- Audio player appears at bottom with full controls
- Click "Stop" to close the player
Prompt Configuration
Prompts are configured in your application config:
config :tas, :prompts,
  voice: "nova",
  response_format: "wav",
  instructions: "Speak clearly and professionally.",
  recordings: [
    %{path: "/sounds/en/us/callie/voicemail/vm-enter_id.wav",
      text: "Please enter your mailbox ID followed by pound"},
    # ... more prompts
  ]
Use Cases
- Initial Setup: Generate all prompts after system installation
- Voice Changes: Re-record all prompts with a different TTS voice
- Quality Improvement: Fix individual prompts that don't sound right
- Format Updates: Regenerate prompts in different audio format (wav → mp3)
- Text Updates: Re-record after changing prompt text in config
- Testing TTS: Preview how prompts will sound before deployment
- Troubleshooting Playback: Verify prompt files exist and are accessible
- Storage Management: Check file sizes and manage disk usage
Tips
- Use "Generate Missing" for initial setup - it won't overwrite existing prompts
- Use "Re-record All" after changing voice or format in config
- Individual "Re-record" is useful for iterating on specific prompts
- Listen to prompts before deployment to ensure quality
- Larger response formats (wav) have better quality but use more disk space
- The instructions field can guide TTS engine for tone and pacing
- Re-recording can take time if you have many prompts - be patient
- Prompts are stored in FreeSWITCH sounds directory for easy access
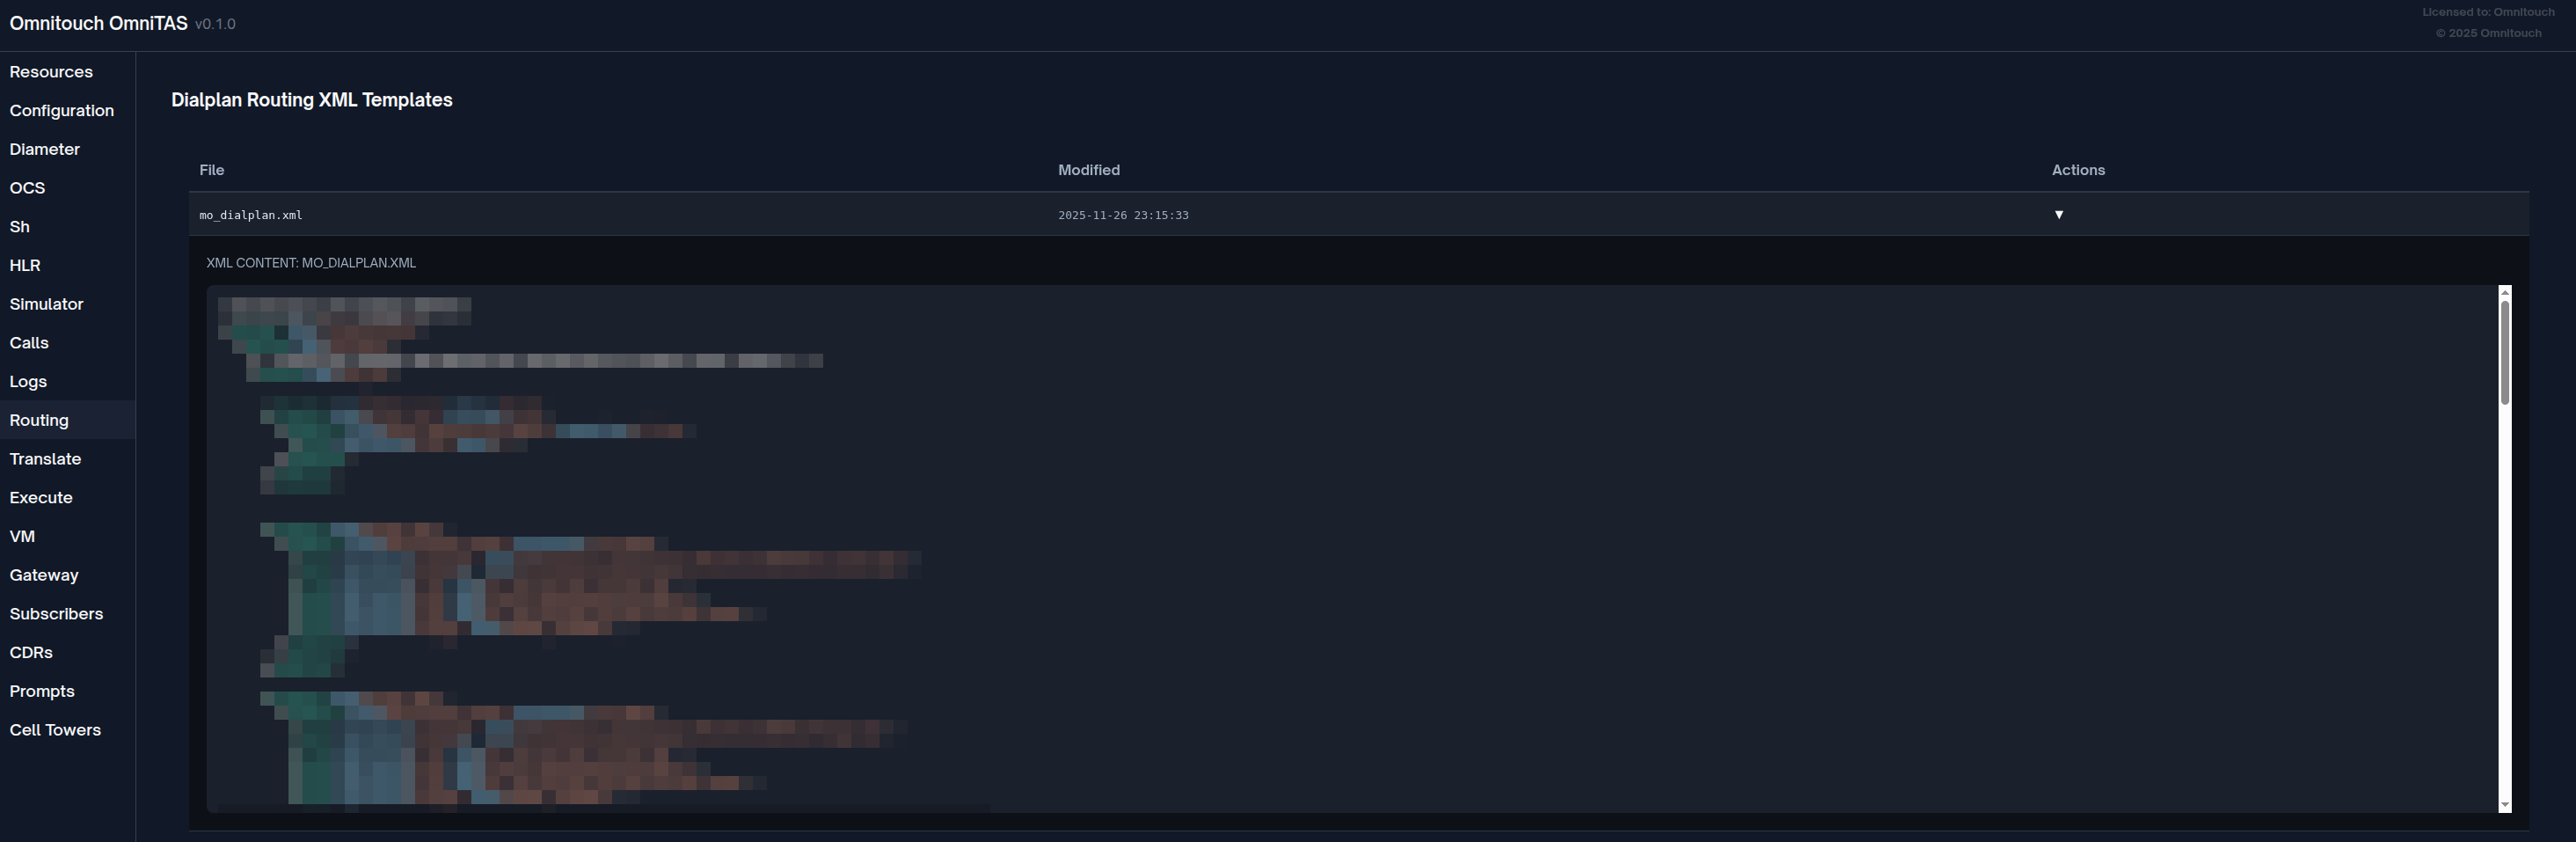
Dialplan XML Templates
View and inspect FreeSWITCH dialplan XML templates used for call routing.
Access: Navigate to /routing in the Control Panel
Features
- Template List: View all XML dialplan templates from
priv/templates/directory - File Details: See filename and last modified timestamp for each template
- Syntax Highlighting: Color-coded XML display for easy reading
- Tags in teal
- Attributes in light blue
- Values in orange/tan
- Comments in green
- Expandable View: Click any template to view its full XML content
- Read-Only View: Safe inspection without risk of accidental modification
- Scrollable Content: Large templates scroll within fixed-height container (max 600px)
How to Use
-
View Template List:
- Page loads with all
.xmlfiles from the templates directory - Sorted alphabetically by filename
- Shows modification timestamp for each file
- Page loads with all
-
Inspect Template:
- Click any row to expand and view the XML content
- Template displays with syntax highlighting
- Click again to collapse
-
Read XML Content:
- Tags (teal): XML element names like
<extension>,<condition> - Attributes (light blue): Attribute names like
name=,field= - Values (orange): Attribute values like
"public","destination_number" - Comments (green): XML comments
<!-- ... -->
- Tags (teal): XML element names like
Use Cases
- Review Dialplan Logic: Inspect routing rules and call flow templates
- Troubleshoot Call Routing: Understand which templates are used for different call types
- Verify Template Syntax: Check XML structure before deployment
- Training & Documentation: Share template contents with team members
- Change Auditing: Compare modification timestamps to track updates
- Template Development: Reference existing templates when creating new ones
Tips
- Templates are loaded from
priv/templates/within the TAS application - Only
.xmlfiles are displayed - Templates are read-only through the web interface
- Modification timestamps help identify recent changes
- Use this view to verify templates match your dialplan expectations
- Syntax highlighting makes complex XML easier to parse visually
- Combine with
/logsview to correlate routing behavior with templates
Technical Details
- Location: Templates stored in
priv/templates/directory - Format: FreeSWITCH XML dialplan format
- File Extension: Only
.xmlfiles listed - Sorting: Alphabetical by filename
- Syntax Highlighting: Client-side colorization using regex patterns
- Max Display Height: 600px with scroll for large files
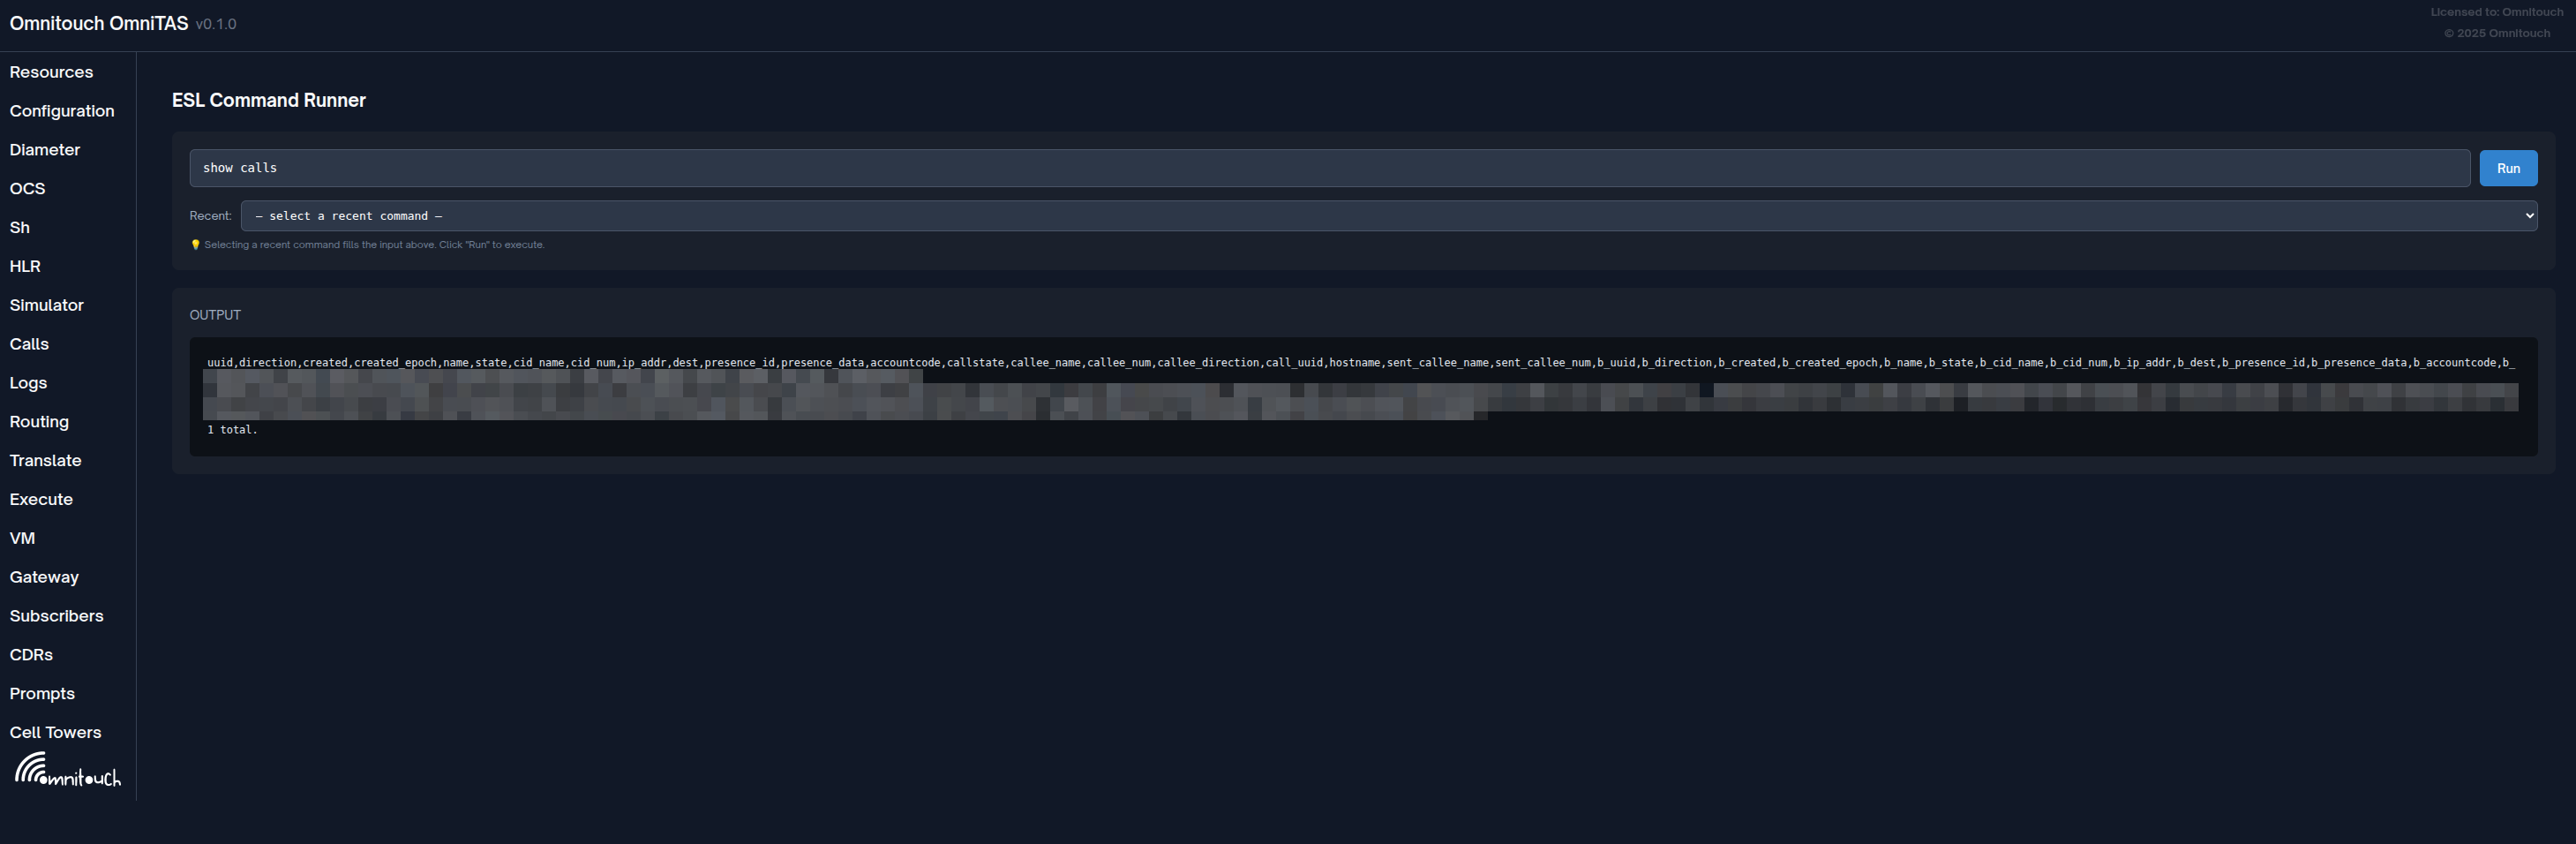
ESL Command Runner
Execute FreeSWITCH Event Socket Layer (ESL) commands directly from the web interface.
Access: Navigate to /command in the Control Panel
Features
- Command Execution: Run any ESL/FreeSWITCH API command
- Live Output: See command results in real-time
- Command History: Recent commands dropdown (last 10 commands)
- Auto-Complete Ready: Monospace input for precise command entry
- Error Handling: Clear display of command errors and exceptions
- No Auto-Execute: Selecting history fills input but requires explicit "Run" click
How to Use
-
Enter Command:
- Type ESL command in the input box
- Examples:
status- Show FreeSWITCH statusshow channels- List active callsuuid_dump <uuid>- Dump all variables for a callsofia status- Show SIP profile statusreloadxml- Reload XML dialplanversion- Show FreeSWITCH version
-
Run Command:
- Click "Run" button to execute
- Button shows "Running…" while executing
- Cannot run multiple commands simultaneously
-
View Output:
- Results appear in the "Output" section below
- Successful commands show raw response
- Errors prefixed with "ERROR:"
- Output is scrollable with max height of 600px
- Monospace font for aligned data
-
Use Command History:
- Recent commands appear in dropdown after first execution
- Select from "Recent:" dropdown to fill input field
- History maintains last 10 unique commands
- Most recent command at top
- Selecting history does NOT auto-execute (safety feature)
Common Commands
| Command | Description | Example Output |
|---|---|---|
status | System status and uptime | FreeSWITCH running info |
show channels | List all active calls | Channel list or "0 total" |
show calls | Summary of active calls | Call count summary |
uuid_dump <uuid> | All variables for a call | Complete variable dump |
uuid_kill <uuid> | Hangup specific call | "+OK" or error |
sofia status | SIP profile status | Profile list and states |
sofia status profile <name> | Specific profile details | Registration count, etc |
reloadxml | Reload dialplan XML | "+OK" confirmation |
version | FreeSWITCH version info | Version string |
global_getvar <var> | Get global variable | Variable value |
api help | List available commands | Command reference |
Use Cases
- Call Debugging: Get detailed info about active call with
uuid_dump - System Status: Check FreeSWITCH health with
statusandshow calls - SIP Troubleshooting: Inspect SIP profiles with
sofia status - Dialplan Reload: Apply config changes with
reloadxml - Emergency Actions: Kill stuck calls with
uuid_kill - Variable Inspection: Check global or channel variables
Troubleshooting
Subscribers Not Showing
- Verify OmniTAS is running
- Check Sofia profile is active:
sofia status profile internal - Verify database path in configuration matches actual database location
CDR Records Not Appearing
- Confirm OmniTAS CDR module is loaded
- Check CDR database exists at configured path
- Verify CDR module configuration in OmniTAS
Performance Considerations
- Large CDR databases (>1M records) may require additional indexing for optimal performance
- Consider archiving old CDR records periodically
- Subscriber registration queries are typically fast as the registration database is small
Configuration
Access Control
The Control Panel should be deployed behind appropriate access controls (firewall, VPN, authentication) as it provides visibility into subscriber activity and call records.