OmniEPDG Control Panel
OmniEPDG includes a web-based control panel for real-time monitoring of sessions, Diameter peers, and system logs. The control panel provides live-updating views without page refreshes.
Table of Contents
- Accessing the Control Panel
- Dashboard
- Sessions View
- Diameter Peers View
- Logs View
- Docs View
- Resources View
- Configuration View
Accessing the Control Panel
The control panel is served on the configured HTTP port (default 4000):
http://<host>:4000/dashboard
Navigation
The control panel provides a sidebar with links to all views:
| Path | View | Description |
|---|---|---|
/dashboard | Dashboard | System overview and quick links |
/sessions | Sessions | Active UE session list |
/diameter | Diameter Peers | Diameter peer connection status |
/logs | Logs | Real-time log streaming |
/docs | Docs | Integrated documentation browser |
/resources | Resources | BEAM VM and application information |
/configuration | Configuration | System configuration viewer |
Dashboard
The Dashboard provides a high-level overview of OmniEPDG status with key metrics and quick navigation.
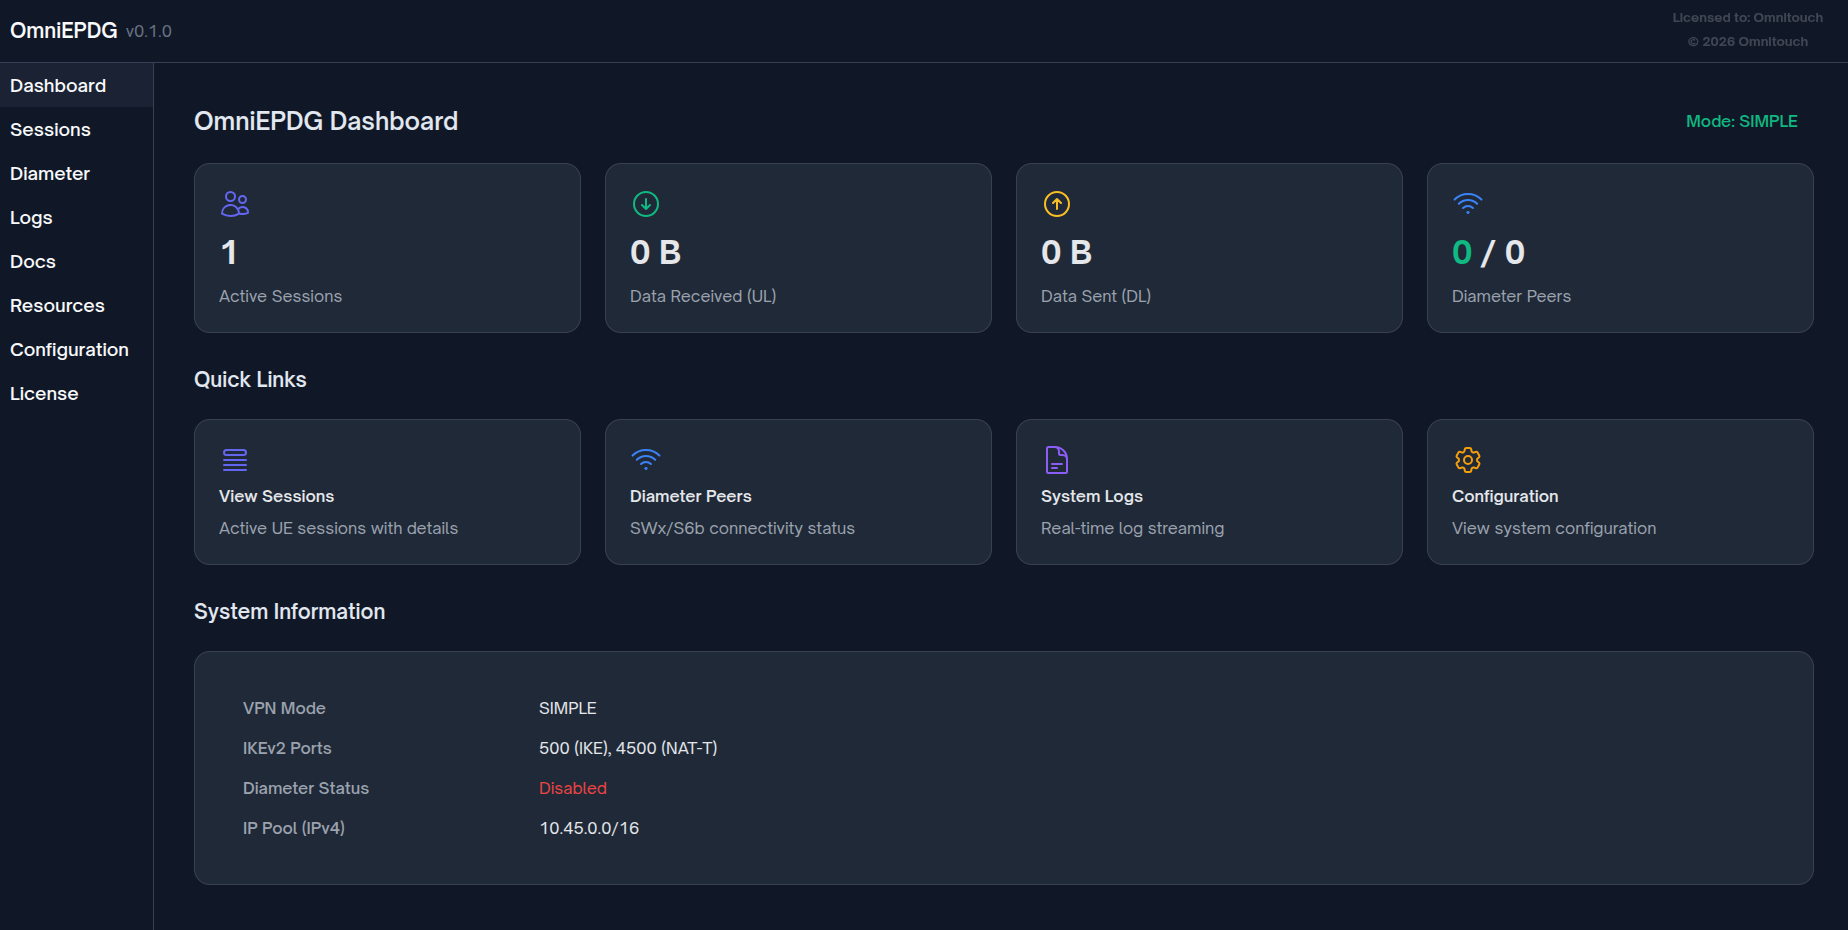
Statistics Cards
The dashboard displays four primary statistics:
| Statistic | Description |
|---|---|
| Active Sessions | Current number of established UE sessions |
| Data Received (UL) | Total bytes received from UEs (uplink direction) |
| Data Sent (DL) | Total bytes sent to UEs (downlink direction) |
| Diameter Peers | Connected peers / total configured peers |
Data values automatically scale to appropriate units (B, KB, MB, GB).
Quick Links
Direct navigation to detailed views:
- View Sessions - Navigate to the Sessions view for detailed UE information
- Diameter Peers - Navigate to the Diameter Peers view for connectivity status
- System Logs - Navigate to the Logs view for real-time log streaming
- Configuration - Navigate to the Configuration view for system settings
System Information
Displays current operational configuration:
| Field | Description |
|---|---|
| VPN Mode | Current mode: GTP or SIMPLE |
| IKEv2 Ports | Standard ports: 500 (IKE), 4500 (NAT-T) |
| Diameter Status | Whether Diameter signaling is enabled |
| IP Pool (IPv4) | Configured IP pool CIDR (Simple VPN mode only) |
Auto-Refresh
The dashboard automatically refreshes every second to display current statistics.
Sessions View
The Sessions view displays all active UE sessions with detailed information for each subscriber.
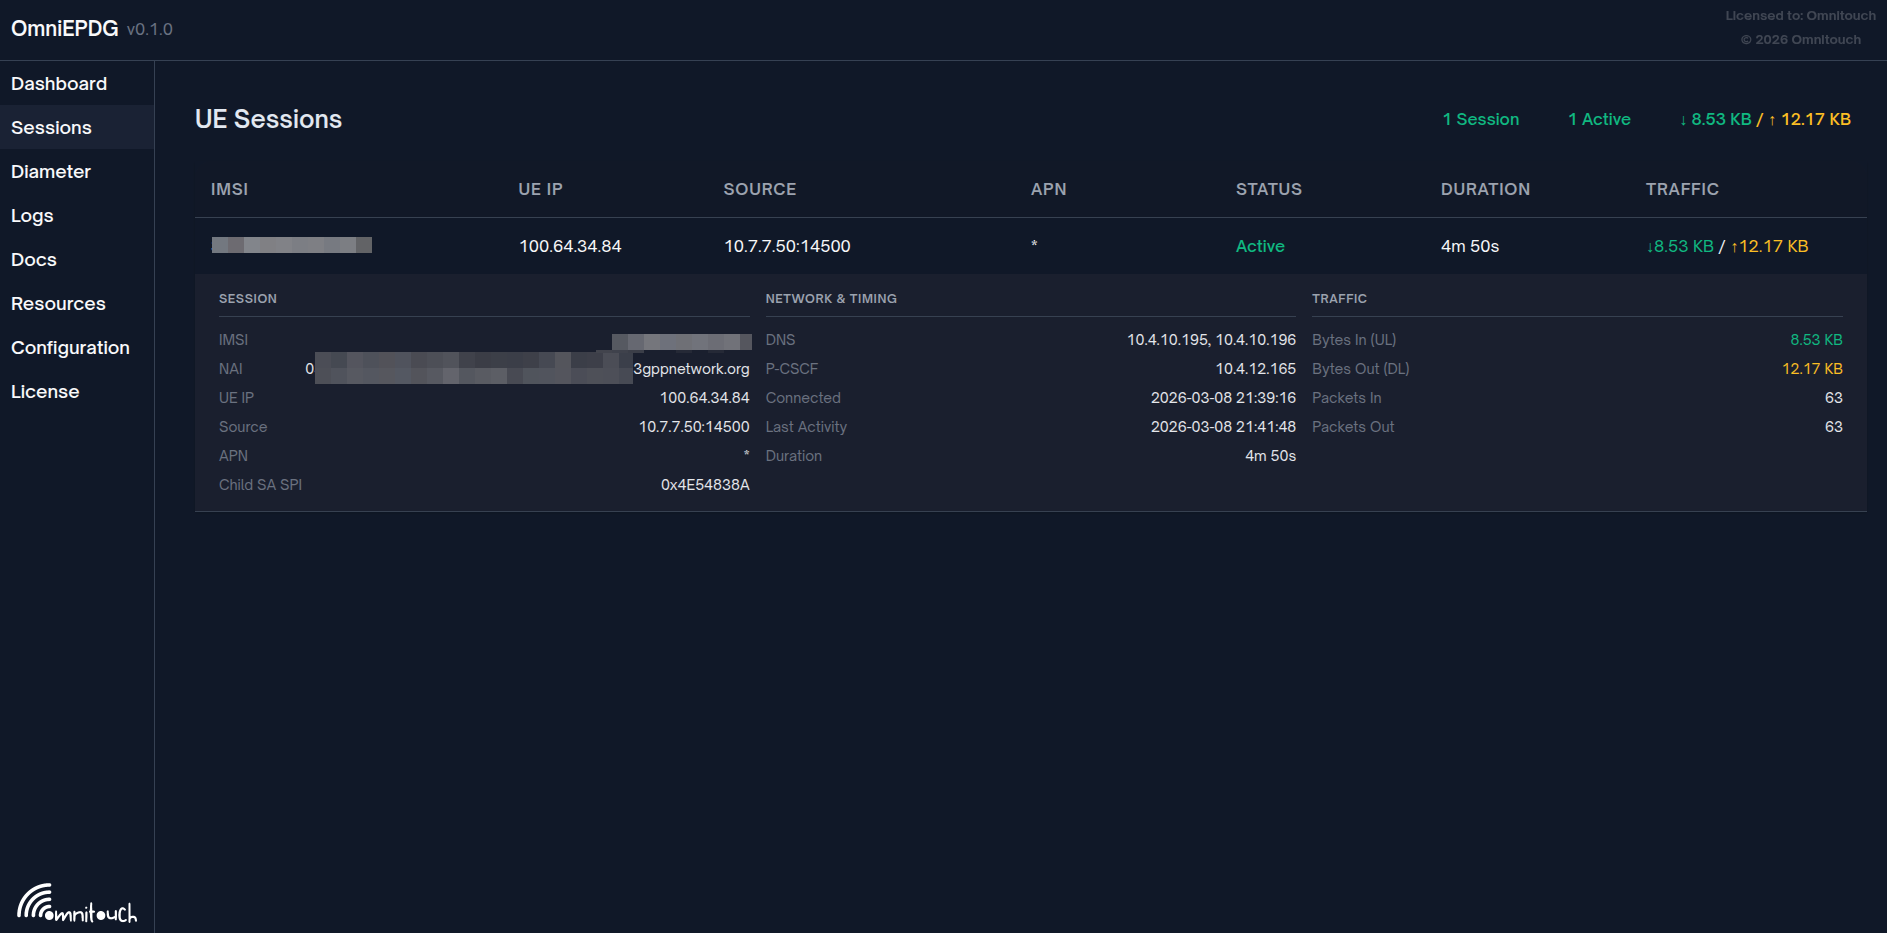
The Sessions view shows active UE connections with real-time traffic statistics and session duration.
Session List
Each session row displays:
| Column | Description |
|---|---|
| IMSI | Subscriber's International Mobile Subscriber Identity |
| UE IP | Assigned IPv4/IPv6 address |
| SOURCE | UE's external IP and port (NAT address) |
| APN | Access Point Name for the connection |
| STATUS | Current session state (Active/Inactive) |
| DURATION | Time since session establishment |
| TRAFFIC | Bytes received / sent (UL/DL) |
Status Indicators
Sessions display status with color-coded badges:
| Status | Color | Description |
|---|---|---|
| Active | Green | Session fully established and operational |
| Connecting | Yellow | Session establishment in progress |
| Inactive | Red | Session terminated or failed |
Session Details
Click any session row to expand detailed information:
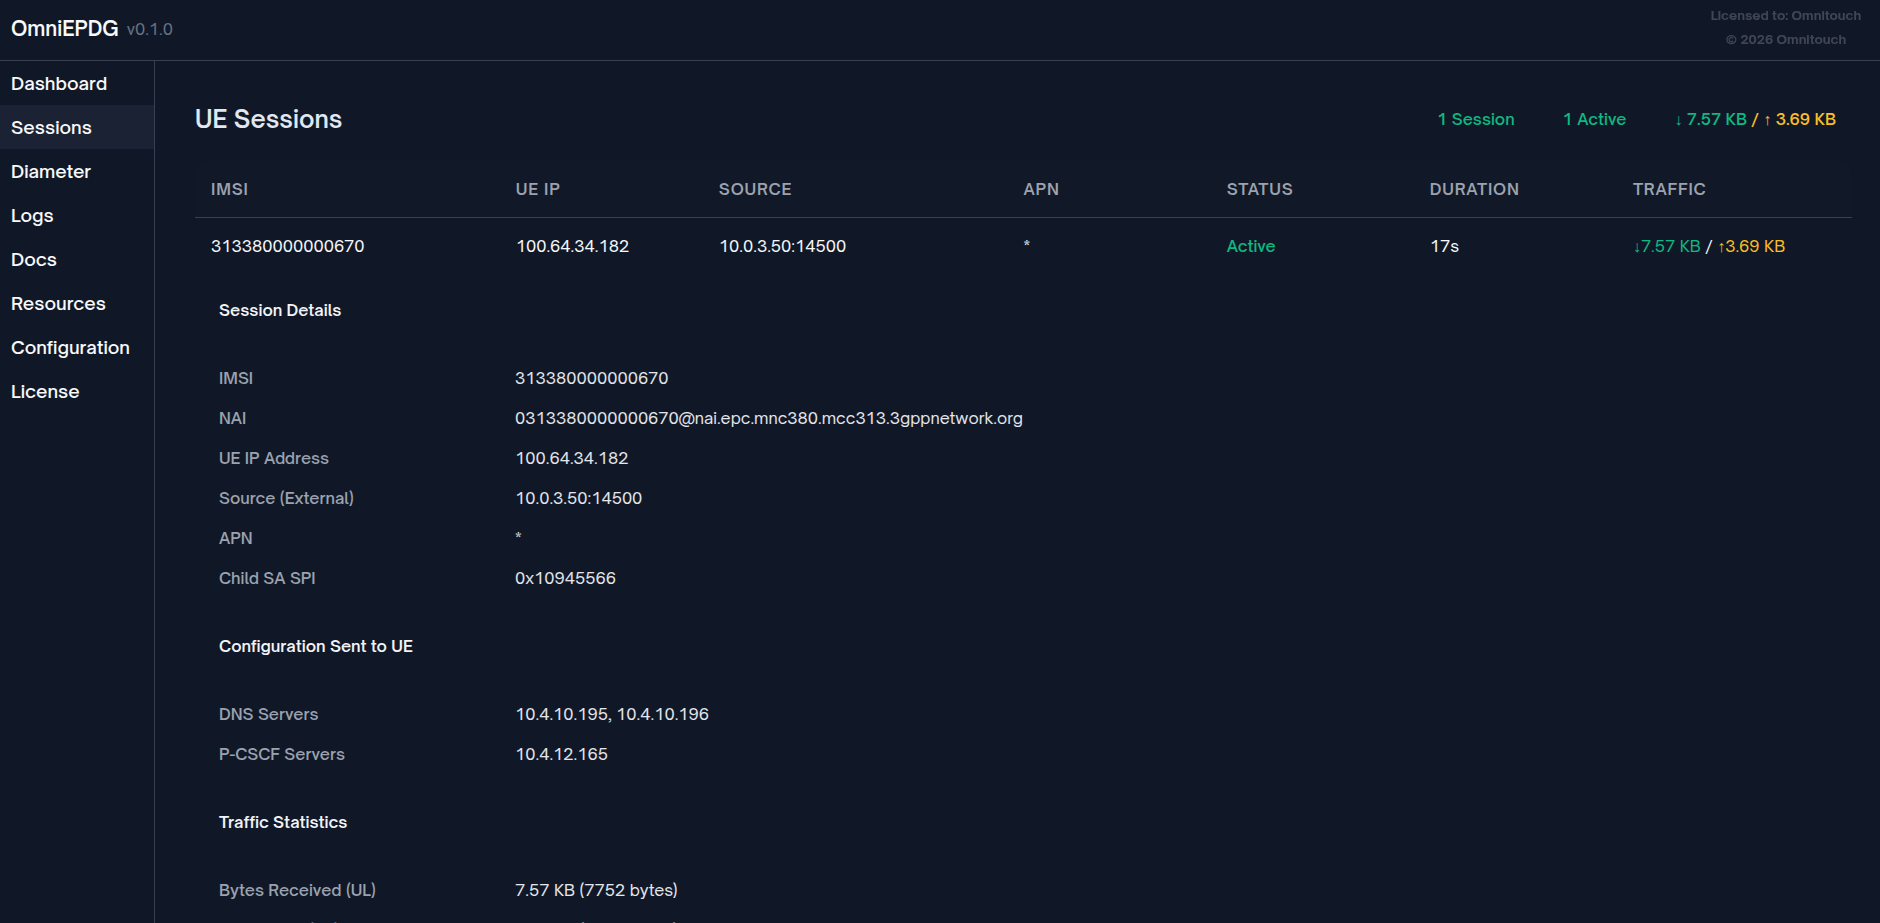
Expanded session view showing IMSI, NAI, network configuration, and traffic statistics.
Session Section
| Field | Description |
|---|---|
| IMSI | Full IMSI value |
| NAI | Network Access Identifier (3GPP format) |
| UE IP | Assigned IPv4/IPv6 address |
| Source | UE's external IP and port (NAT address) |
| APN | Access Point Name for the PDN connection |
| Child SA SPI | IPSec Child SA Security Parameter Index |
Network & Timing Section
| Field | Description |
|---|---|
| DNS | DNS servers provided to the UE |
| P-CSCF | Proxy-CSCF servers for IMS signaling |
| Connected | Timestamp when session was established |
| Last Activity | Timestamp of most recent packet activity |
| Duration | Time since session establishment |
Traffic Section
| Field | Description |
|---|---|
| Bytes In (UL) | Total bytes received from UE (uplink) |
| Bytes Out (DL) | Total bytes sent to UE (downlink) |
| Packets In | Total packets received from UE |
| Packets Out | Total packets sent to UE |
Empty State
When no sessions are active, the view displays:
- "No active sessions" message
- Indicates whether UE connections should be attempted
Auto-Refresh
The session list automatically refreshes every second.
Diameter Peers View
The Diameter Peers view displays the status of all configured Diameter peers (HSS for SWx, PGW for S6b).
Peer List
Each peer row displays:
| Column | Description |
|---|---|
| Peer | Diameter Identity (Origin-Host) |
| Realm | Diameter Realm (Origin-Realm) |
| IP Address | Transport address in format protocol://ip:port |
| Status | Connection status |
Status Indicators
| Status | Color | Description |
|---|---|---|
| Connected | Green | Diameter peer connection established |
| Disconnected | Red | Peer not connected |
| Unknown | Gray | Status cannot be determined |
Peer Count Summary
The header displays aggregate counts:
- X Connected - Number of peers with active connections
- Y Disconnected - Number of peers without connections
Peer Details
Click any peer row to expand detailed information:
| Field | Description |
|---|---|
| Connection Initiation | Who initiates: local (we connect to peer) or remote (peer connects to us) |
| Transport | Protocol: tcp or sctp |
| Product Name | Peer's advertised product name from CER/CEA |
| Advertised Applications | Diameter Application IDs supported by the peer |
Empty State
When no peers are configured, the view displays:
- "No Diameter Peers configured" if Diameter is enabled
- "Diameter is disabled" with configuration hint if disabled
Auto-Refresh
The peer list automatically refreshes every second.
Logs View
The Logs view provides real-time streaming of system logs with filtering and search capabilities.
Log Display
Logs appear in a scrolling container with newest entries at the bottom. Each log entry displays:
| Element | Description |
|---|---|
| Timestamp | When the log entry was generated |
| Level | Severity level with color coding |
| Message | Log message content |
Log Levels
Logs are color-coded by severity:
| Level | Color | Description |
|---|---|---|
| debug | Gray | Detailed diagnostic information |
| info | Blue | General informational messages |
| warning | Yellow | Warning conditions |
| error | Red | Error conditions |
Level Filtering
Filter logs by minimum severity level using the dropdown:
| Filter | Shows |
|---|---|
| All Levels | debug, info, warning, error |
| Info+ | info, warning, error |
| Warning+ | warning, error |
| Error Only | error |
Search
The search box filters logs in real-time:
- Enter any text to filter log messages
- Matching is case-insensitive
- Clears when the search box is emptied
Controls
| Control | Description |
|---|---|
| Pause/Resume | Toggle log streaming on/off |
| Clear | Remove all displayed logs |
| Auto-scroll | Toggle automatic scrolling to newest entries |
Log Buffer
- Maximum 1000 log entries are retained
- Oldest entries are removed when the limit is reached
- Clearing logs removes all entries from the display
Empty State
When no logs match the current filters:
- "No logs to display" message
- Verify filter settings if logs are expected
Auto-Refresh
New logs appear automatically as they are generated (when not paused).
Docs View
The Docs view provides an integrated documentation browser, allowing operators to access all OmniEPDG documentation directly from the control panel.
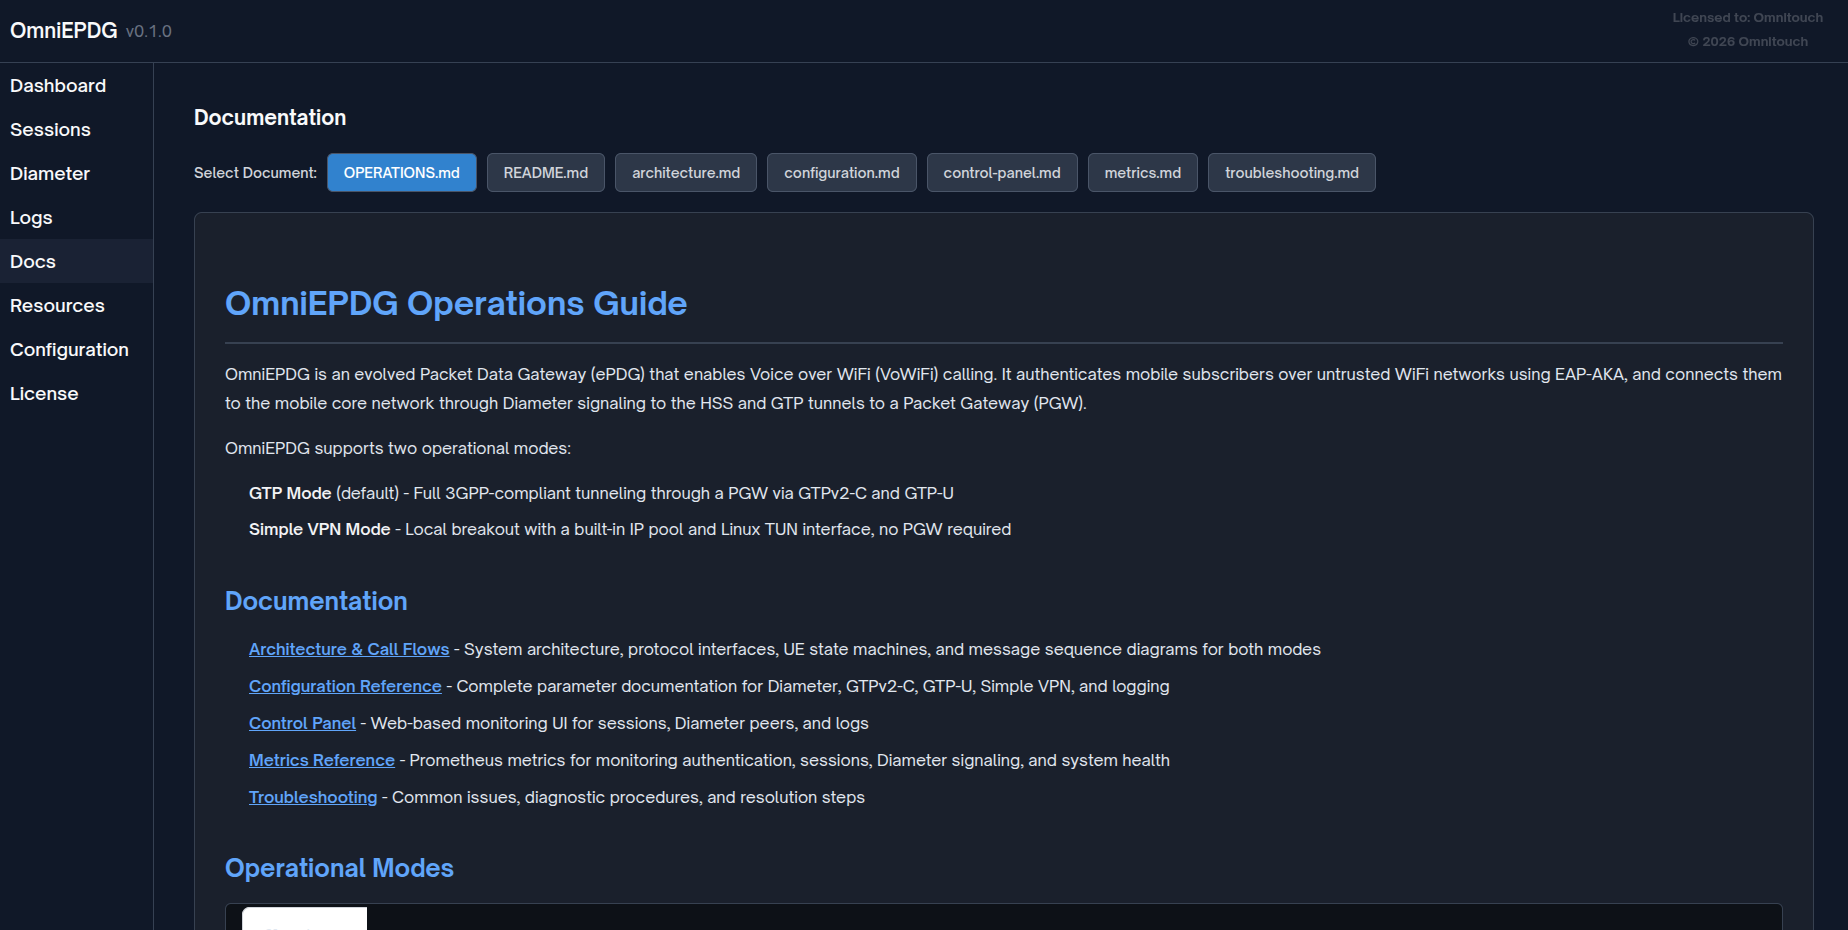
Document Selection
Select from available documentation files using the button bar:
| Document | Description |
|---|---|
| OPERATIONS.md | Operations guide with quick start and procedures |
| README.md | Project overview and setup instructions |
| architecture.md | System architecture and call flows |
| configuration.md | Complete configuration reference |
| control-panel.md | This control panel guide |
| metrics.md | Prometheus metrics reference |
| troubleshooting.md | Common issues and resolution steps |
Markdown Rendering
Documentation is rendered with full Markdown support including:
- Headers and text formatting
- Code blocks with syntax highlighting
- Tables
- Links (internal and external)
- Lists and blockquotes
Resources View
The Resources view displays BEAM VM statistics and running OTP applications.
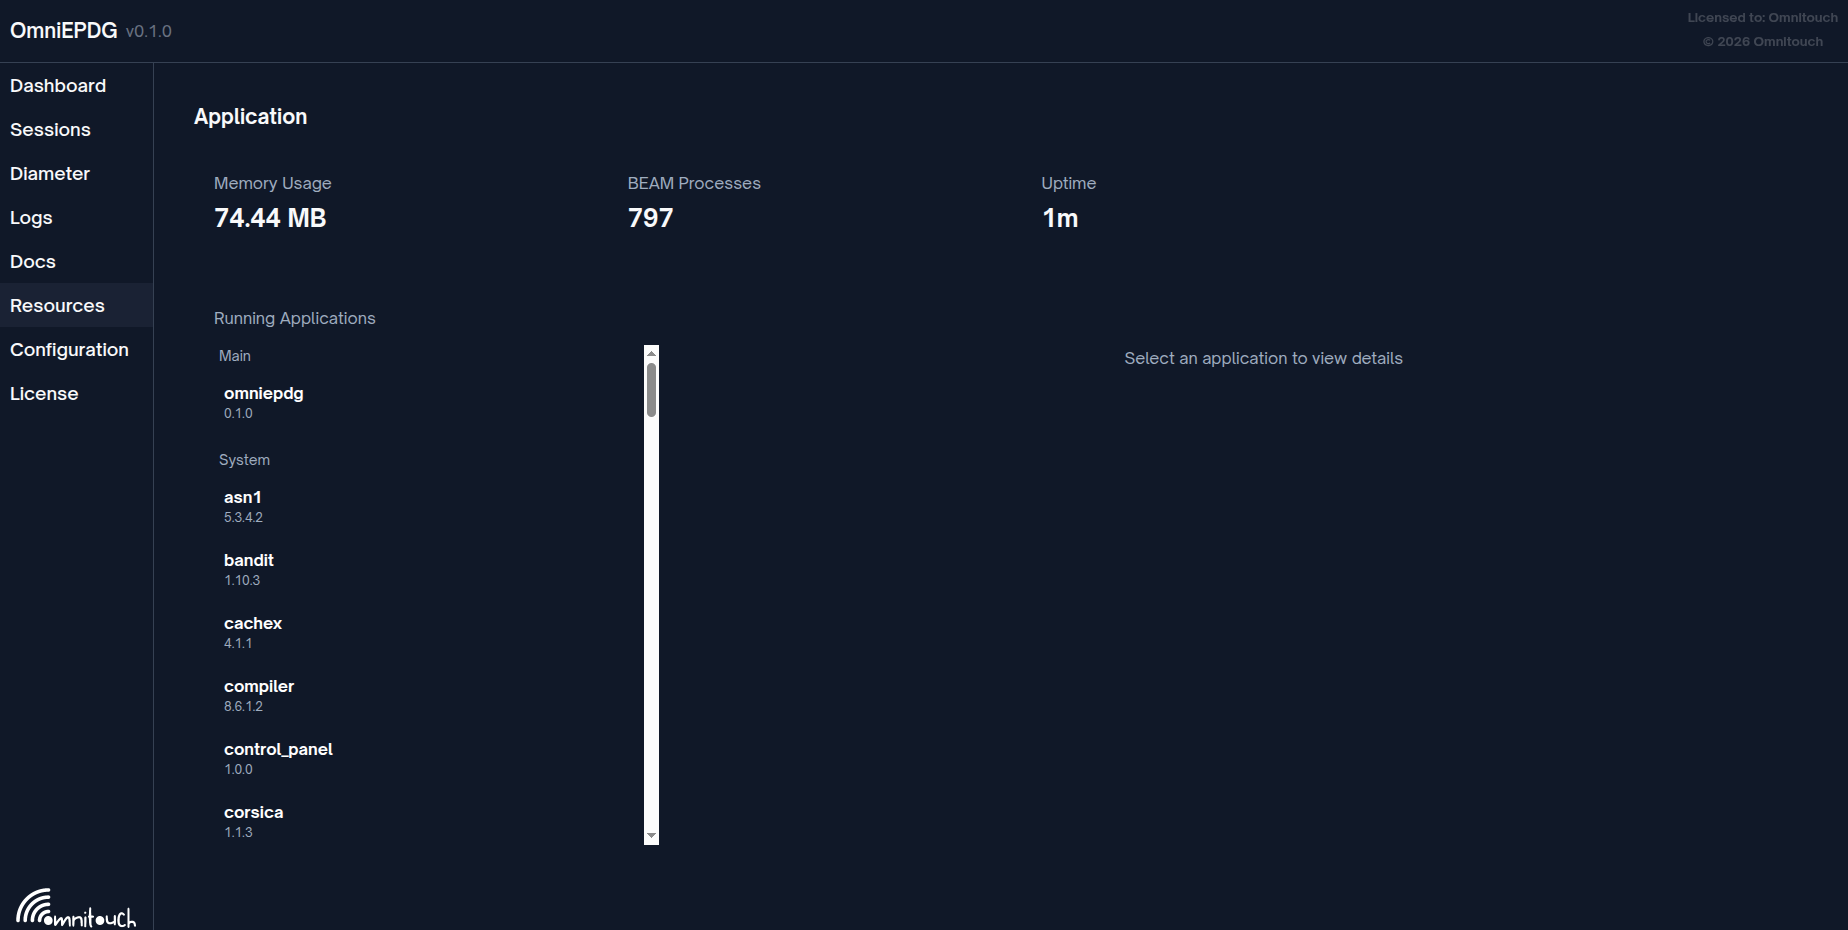
System Metrics
| Metric | Description |
|---|---|
| Memory Usage | Total memory used by the BEAM VM |
| BEAM Processes | Number of Erlang/Elixir processes running |
| Uptime | Time since the application started |
Running Applications
Lists all loaded OTP applications grouped by category:
| Category | Description |
|---|---|
| Main | The OmniEPDG application |
| System | Core Erlang/OTP and Elixir applications |
Click an application to view its details including version, description, and dependencies.
Configuration View
The Configuration view displays runtime configuration and loaded applications.
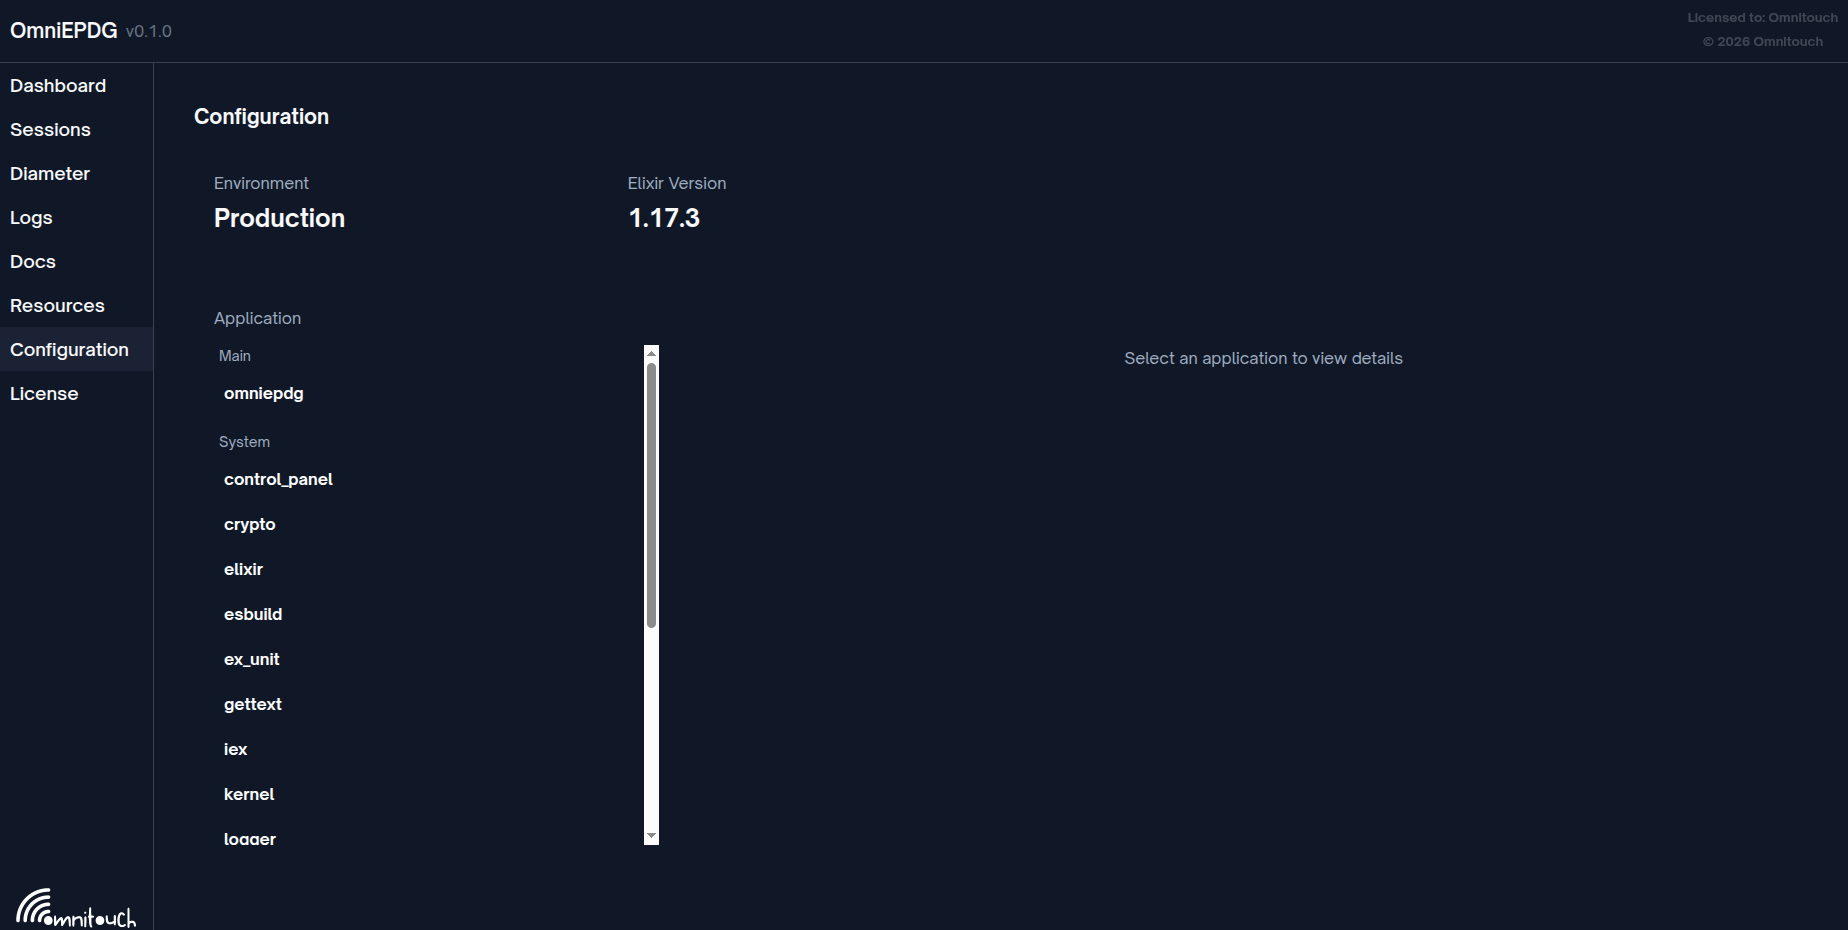
Environment Information
| Field | Description |
|---|---|
| Environment | Current Mix environment (Development/Production) |
| Elixir Version | Running Elixir version |
Application List
Displays all loaded OTP applications with their versions. Select an application to view:
- Application description
- Version information
- Dependencies
- Configuration parameters
Control Panel Configuration
HTTP Port
Configure the control panel port in config/runtime.exs:
config :omniepdg, OmniEpdg.Web.Endpoint,
  http: [port: 4000]
| Parameter | Type | Default | Description |
|---|---|---|---|
port | Integer | 4000 | HTTP port for the control panel |
Disabling the Control Panel
The control panel can be disabled by not starting the web endpoint in production if not needed. Contact your system integrator for deployment-specific configuration.