RAN Monitor Operations Guide
Radio Access Network (RAN) Monitoring & Management Platform
by Omnitouch Network Services
Table of Contents
- Overview
- What RAN Monitor Does
- System Architecture
- Web UI Overview
- Monitoring with Grafana
- Common Operations
- Documentation Index
- Quick Reference
- Support
Overview
RAN Monitor is a management and monitoring platform for Nokia AirScale base stations in 3GPP LTE and 5G networks. It provides real-time visibility into your RAN equipment health, performance, and configuration.
Key Features
- Real-Time Monitoring - Continuous collection of performance metrics and alarms
- Automated Management - Maintains persistent connections with base stations
- Historical Analytics - Stores data for trend analysis and capacity planning
- Web Dashboard - Real-time operational visibility through built-in Web UI
- Grafana Integration - Advanced analytics and custom dashboards
System Components
| Component | Purpose | Access |
|---|---|---|
| RAN Monitor Manager | Core application managing base station connections | Background service |
| Web UI Control Panel | Real-time operational dashboard | https://<server>:9443 |
| MySQL Database | Session state and device configuration | Internal |
| InfluxDB | Time-series metrics storage | http://<server>:8086 |
| Grafana | Analytics dashboards and alerting | http://<server>:3000 |
| TCE NSNTI Server | Trace collection from base stations | TCP port 49151 |
| TCE TZSP Forwarder | Real-time trace export to Wireshark | UDP port 37008 |
Example: Detailed Monitoring Dashboard
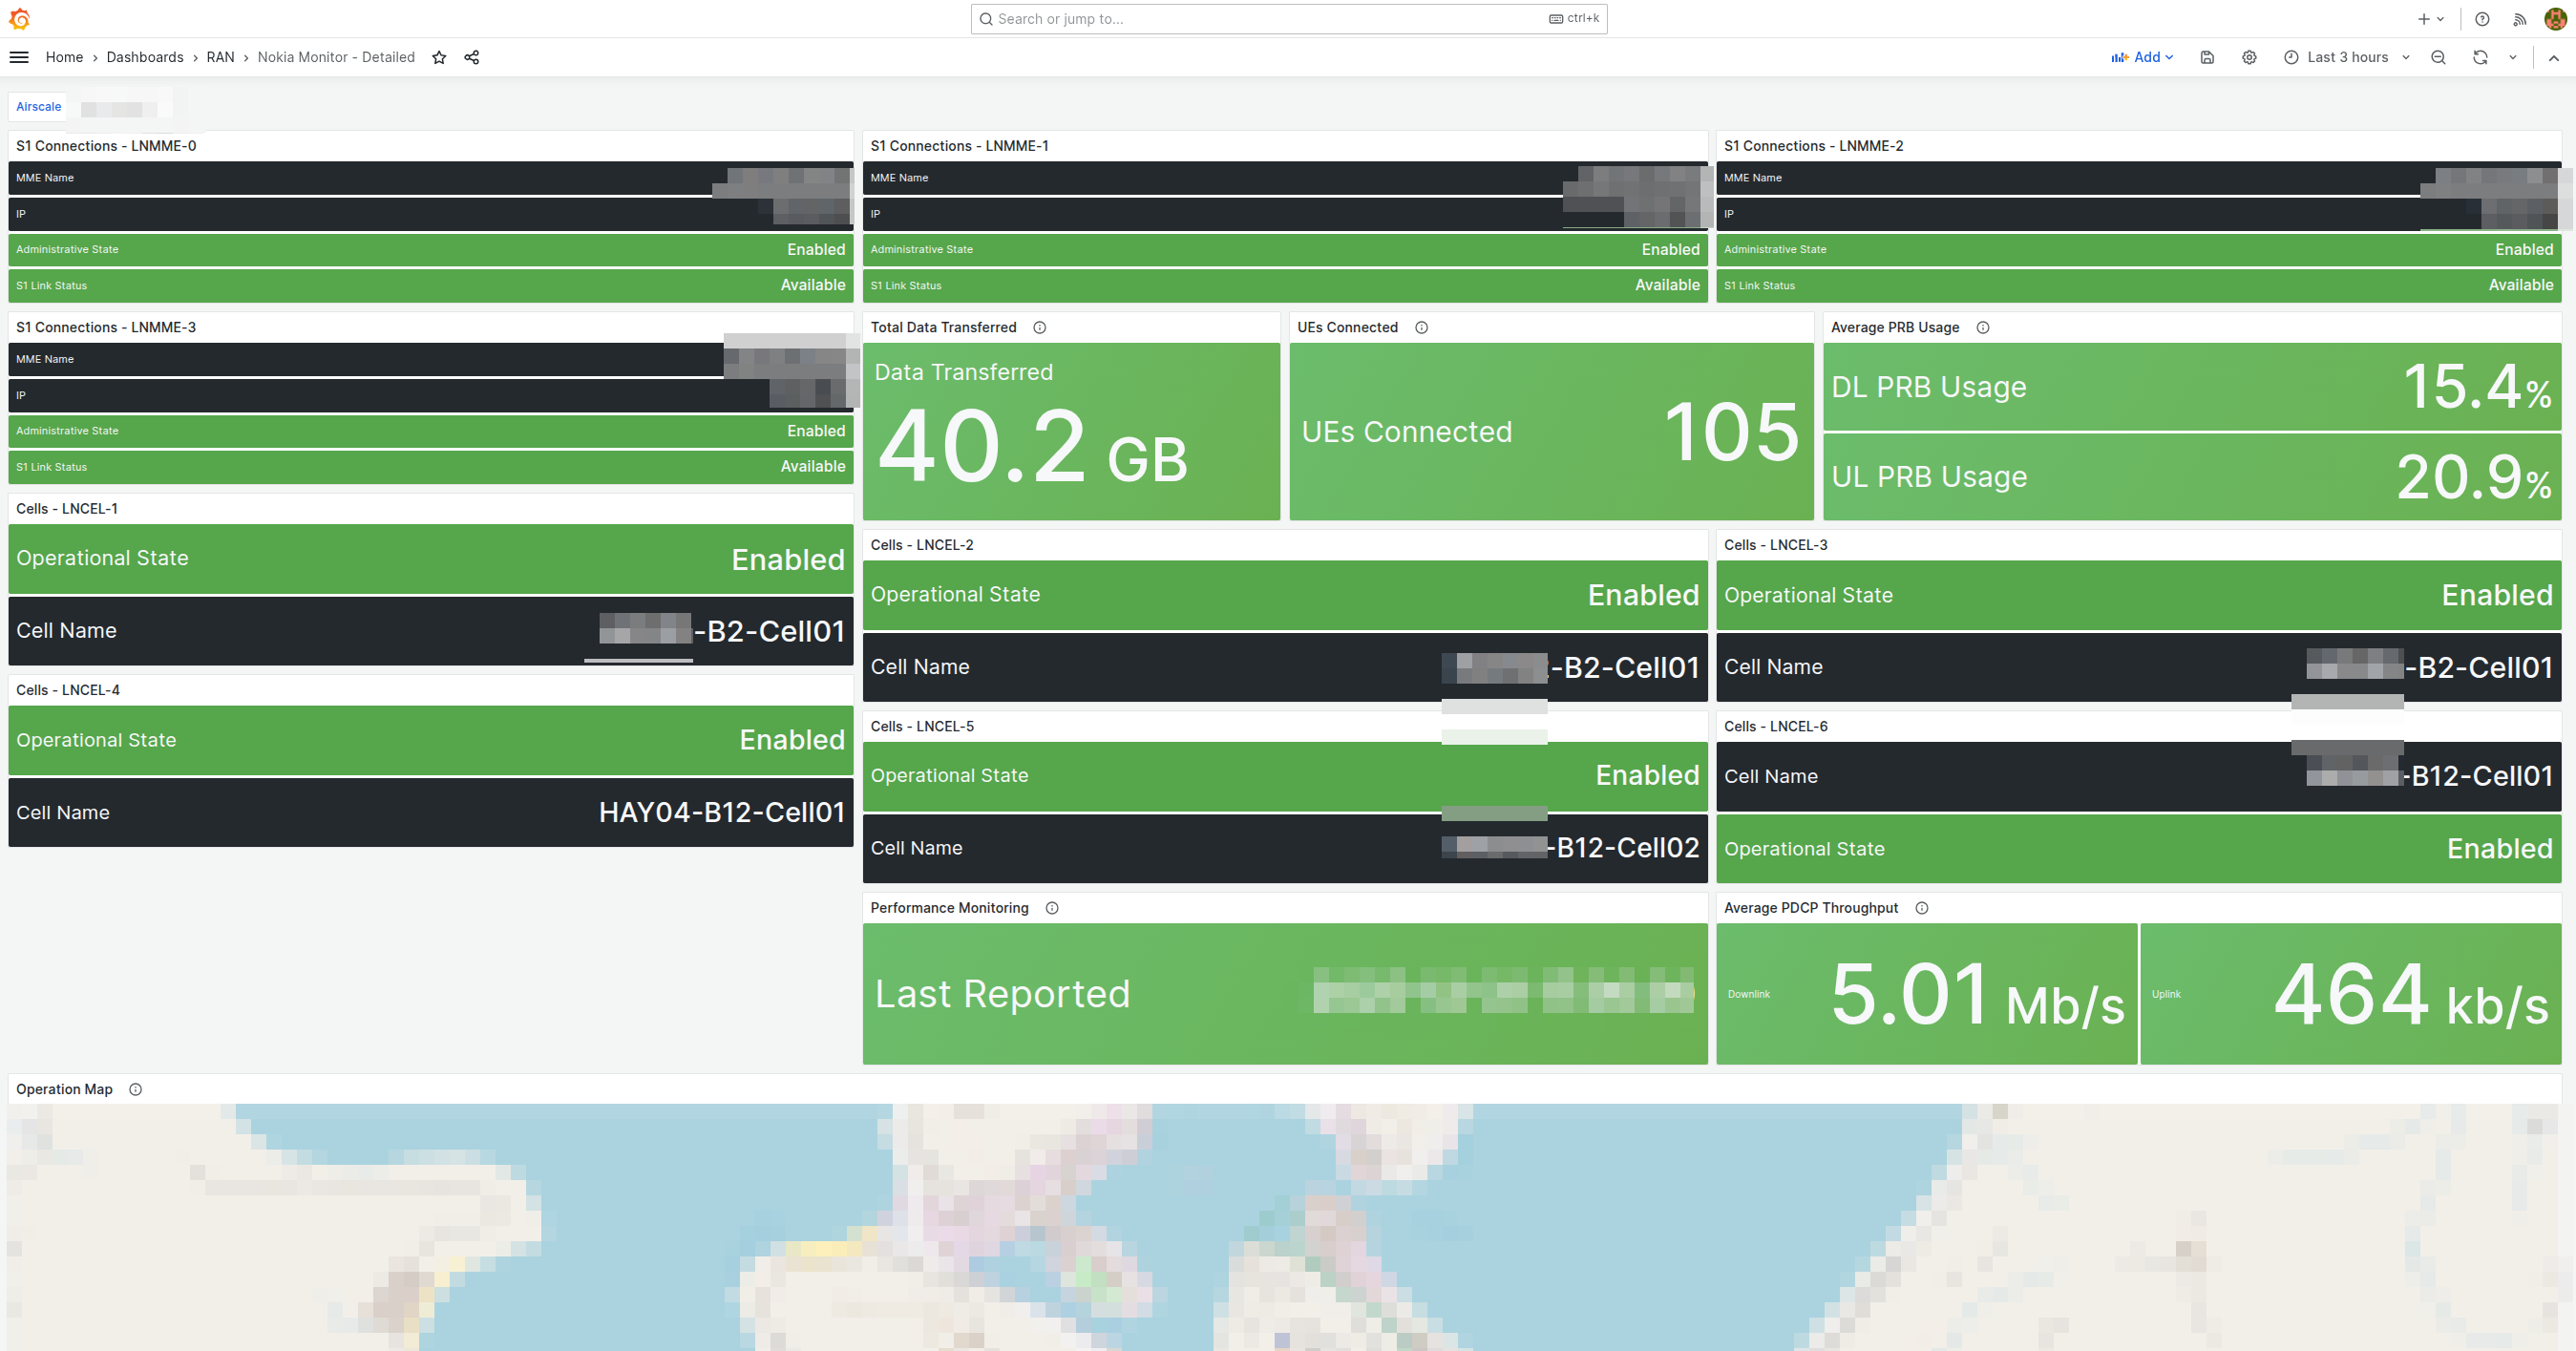
Comprehensive monitoring dashboard showing S1 connections status by LNMME, operational state, data transferred, UEs connected, average PRB usage, performance monitoring metrics, and geographic coverage map. This dashboard provides network operators with at-a-glance visibility into device health, connectivity status, and key performance indicators.
What RAN Monitor Does
RAN Monitor operates continuously in the background to:
- Register and Connect - Establishes secure connections with your Nokia base stations
- Collect Performance Data - Gathers KPIs every 10 seconds (configurable)
- Monitor Alarms - Tracks faults and their severity levels
- Track Configuration - Records system state and parameter changes
- Store Historical Data - Preserves metrics in time-series database
- Provide Visibility - Displays real-time status through Web UI and Grafana
Data Flow
What Gets Collected
Performance Metrics:
- Cell availability and uptime
- Traffic throughput (uplink/downlink)
- Resource utilization (PRB usage)
- Call setup success rates
- Handover performance
- Radio quality measurements
Alarms:
- Fault severity (Critical, Major, Minor, Warning)
- Affected systems and components
- Probable cause and descriptions
- Timestamps and durations
Configuration:
- Complete XML configuration snapshots (stored as versioned files)
- Automatic change detection and versioning
- Configuration history and audit trail
- Last 10 versions retained per device
For config management details, see the Configuration Archive Guide.
For detailed counter definitions, see the Nokia Counter Reference.
System Architecture
Infrastructure Overview
Configuration Overview
For complete configuration details, see the Runtime Configuration Guide.
Trace Collection Entity (TCE)
RAN Monitor includes an integrated Trace Collection Entity for capturing and analyzing LTE/5G protocol messages. This enables detailed troubleshooting, drive testing, and RF optimization.
What is TCE?
The Trace Collection Entity receives trace data from Nokia AirScale base stations containing:
- S1-AP Messages - Control plane signaling between eNodeB and EPC
- RRC Messages - Radio Resource Control signaling
- NAS Messages - Non-Access Stratum signaling
- User Plane Data - PDCP layer throughput information
Use Cases
Drive Testing:
- Capture end-user RF experience
- Analyze handover performance
- Measure signal quality (RSRP, RSRQ, SINR)
- Identify coverage holes
Troubleshooting:
- Debug call setup failures
- Analyze handover issues
- Investigate dropped calls
- Review mobility events
RF Optimization:
- PCI planning validation
- Neighbor relation optimization
- Handover parameter tuning
- Coverage and capacity analysis
For complete trace collection procedures and Wireshark analysis, see the TCE MDT Data Collection Guide.
Web UI Overview
RAN Monitor includes a built-in Web UI for real-time operational monitoring and management.
Access: https://<ran-monitor-ip>:9443
The main dashboard provides at-a-glance visibility into system health, device status, and active alarms.
Key Pages
Main Dashboard
Real-time system overview with:
- System health indicators
- Device status summary (associated/failed counts)
- Active alarm counts by severity
- Recent activity and events
Auto-refreshes every 5 seconds for real-time visibility.
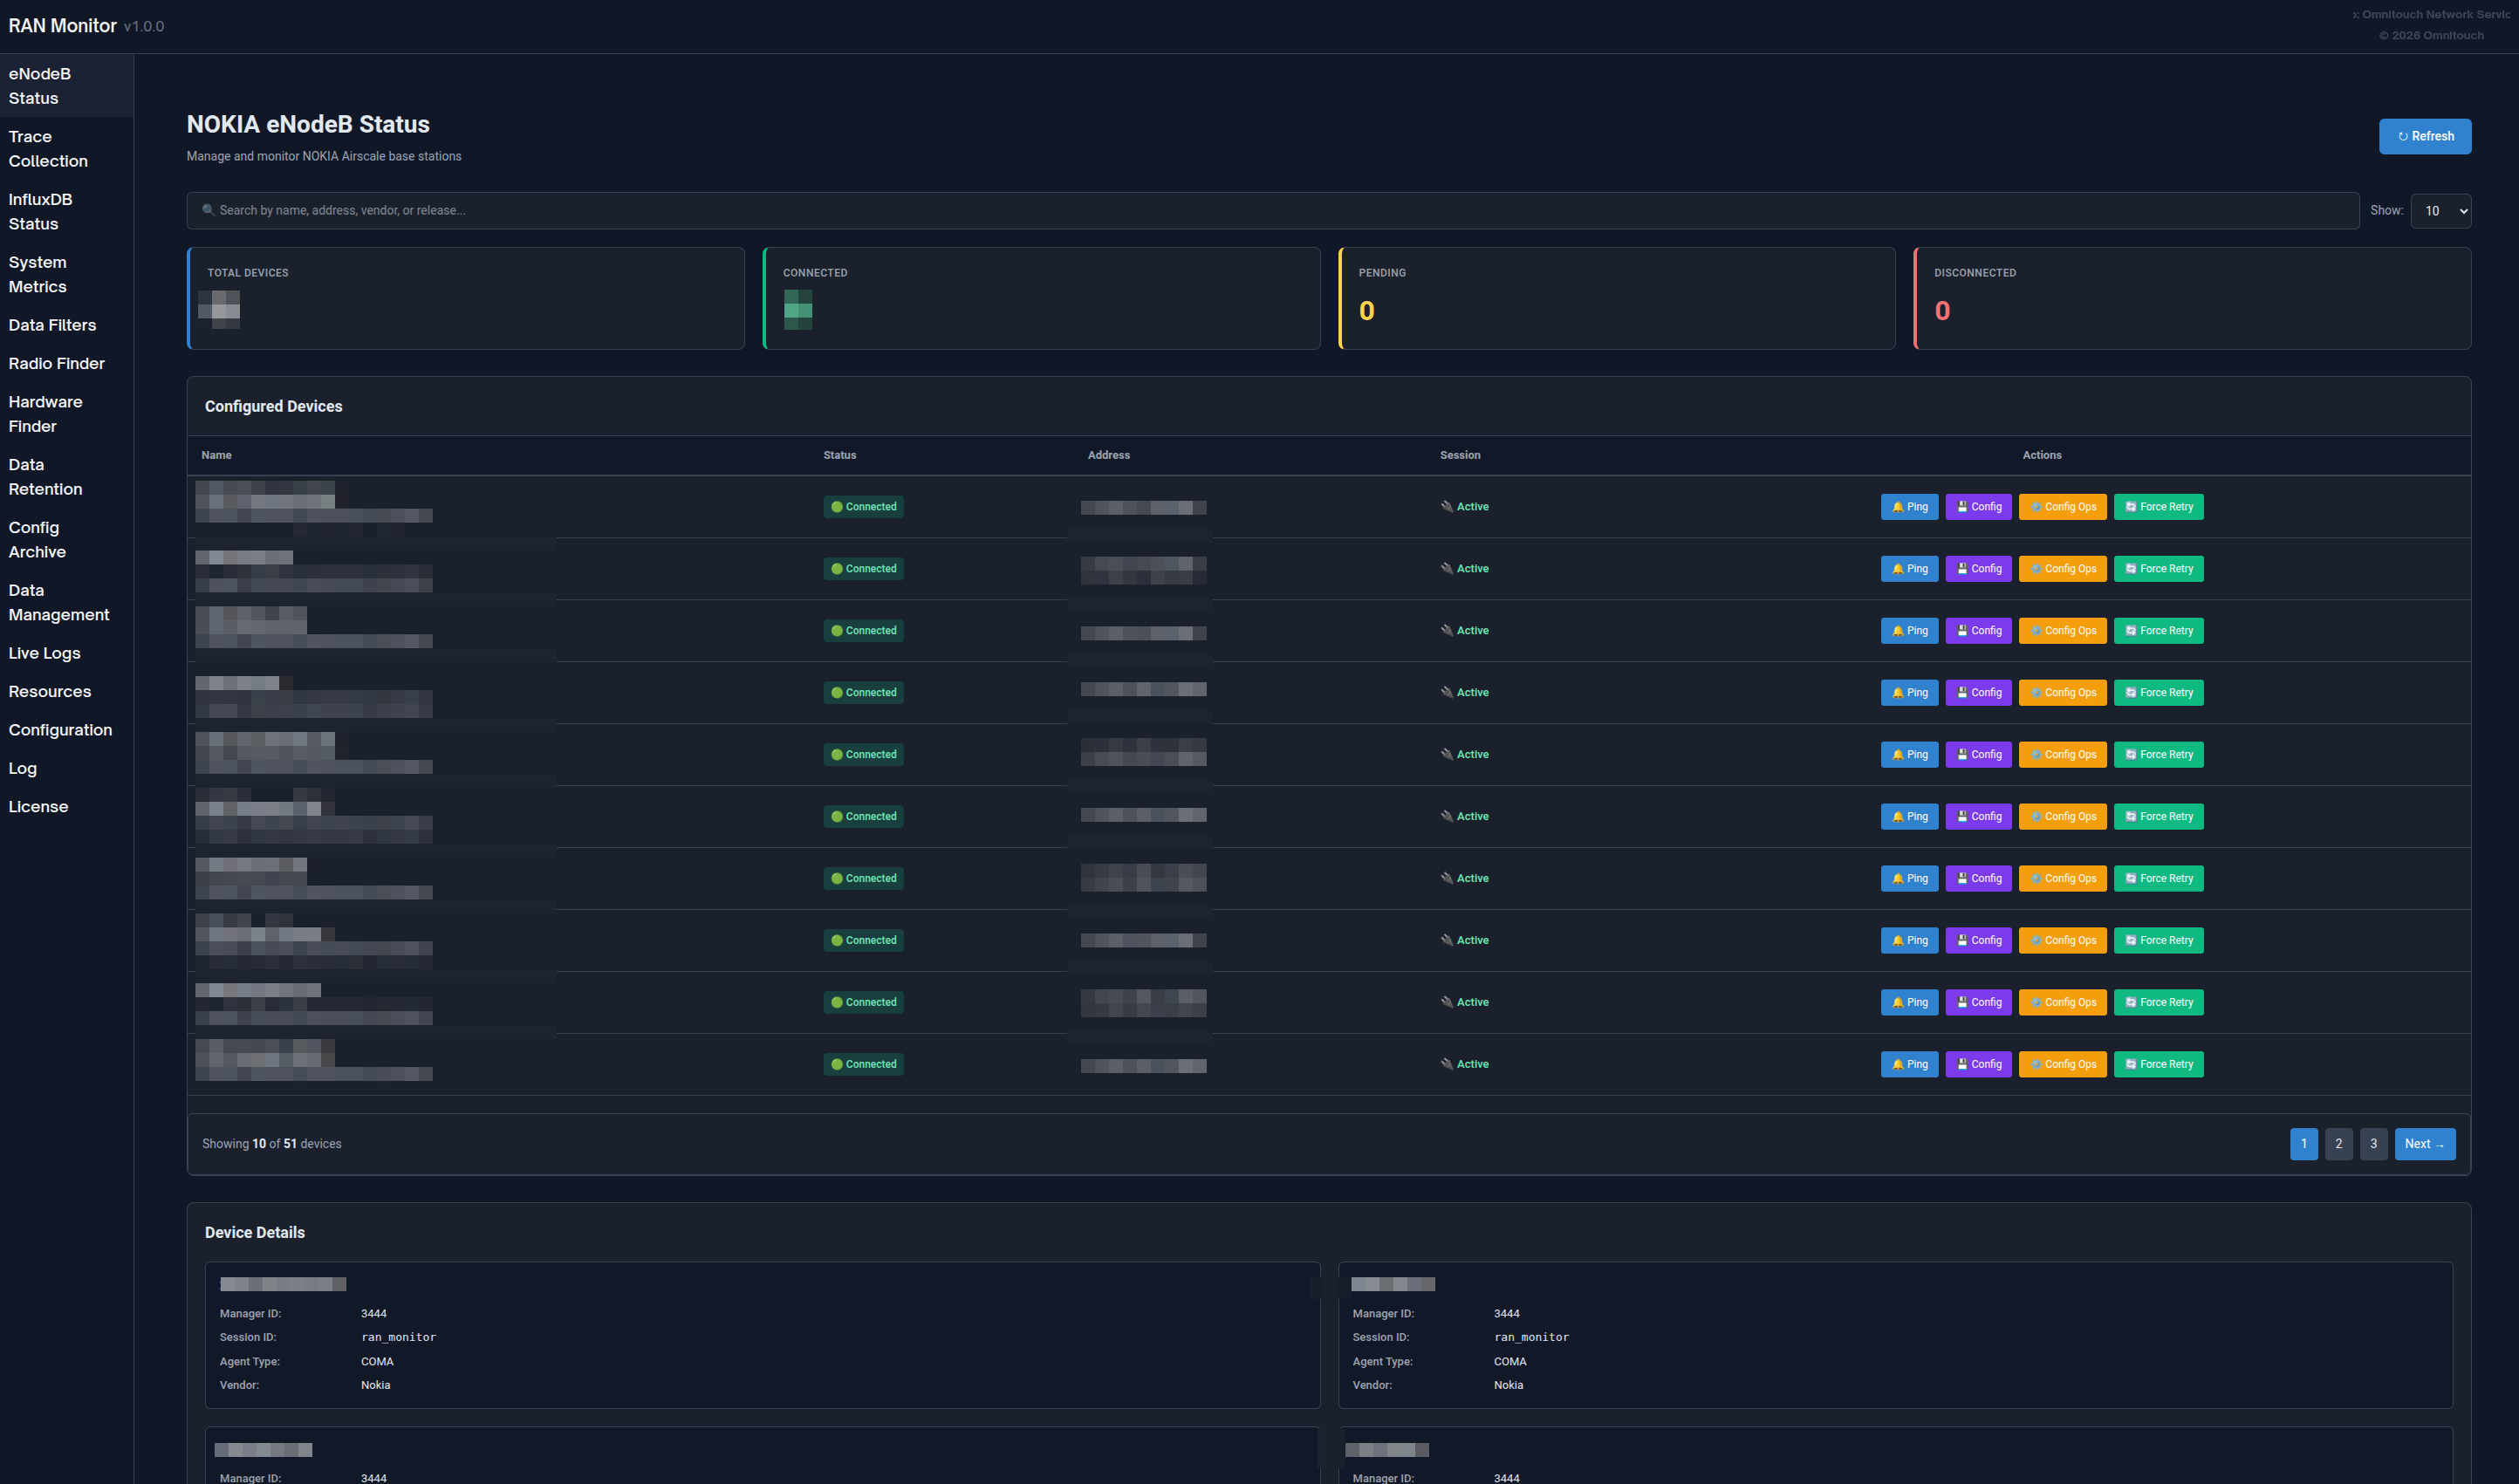
Base Stations Page
View all managed devices with their current status:
- Connection status (green = associated, red = failed)
- Registration state and session information
- Last contact timestamp
- Filter, search, and sort capabilities
Click any device to view detailed information including registration details, session lifecycle, recent metrics, and active alarms.

Alarms Page
Monitor all faults across your network:
- Color-coded by severity (Red = Critical, Orange = Major, Yellow = Minor, Blue = Warning, Green = Cleared)
- Alarm details, probable cause, affected system
- Timestamps and duration tracking
- Sort by severity and filter capabilities
For alarm handling procedures, see the Alarm Management Guide.
Configuration Management
Safely manage base station configurations:
- Download current configuration (backup)
- Upload new configuration → receive Plan ID
- Validate configuration using Plan ID
- Activate validated configuration
- Verify changes took effect
Always validate before activating to prevent service interruptions.
Configuration Archive: All configuration changes are automatically tracked and versioned. View historical configs, download previous versions, or compare changes via the Config Archive page.
For detailed procedures, see the Web UI Guide - Configuration Management and Configuration Archive Guide.

Unconfigured eNodeBs
Discover base stations attempting to connect that aren't yet configured:
- Agent ID (use when adding to configuration)
- Last seen timestamp
- Number of connection attempts
- Actions: Refresh, Delete, Clear All
Use Case: When new base stations are deployed, they appear here. Copy the Agent ID and add them to config/runtime.exs.
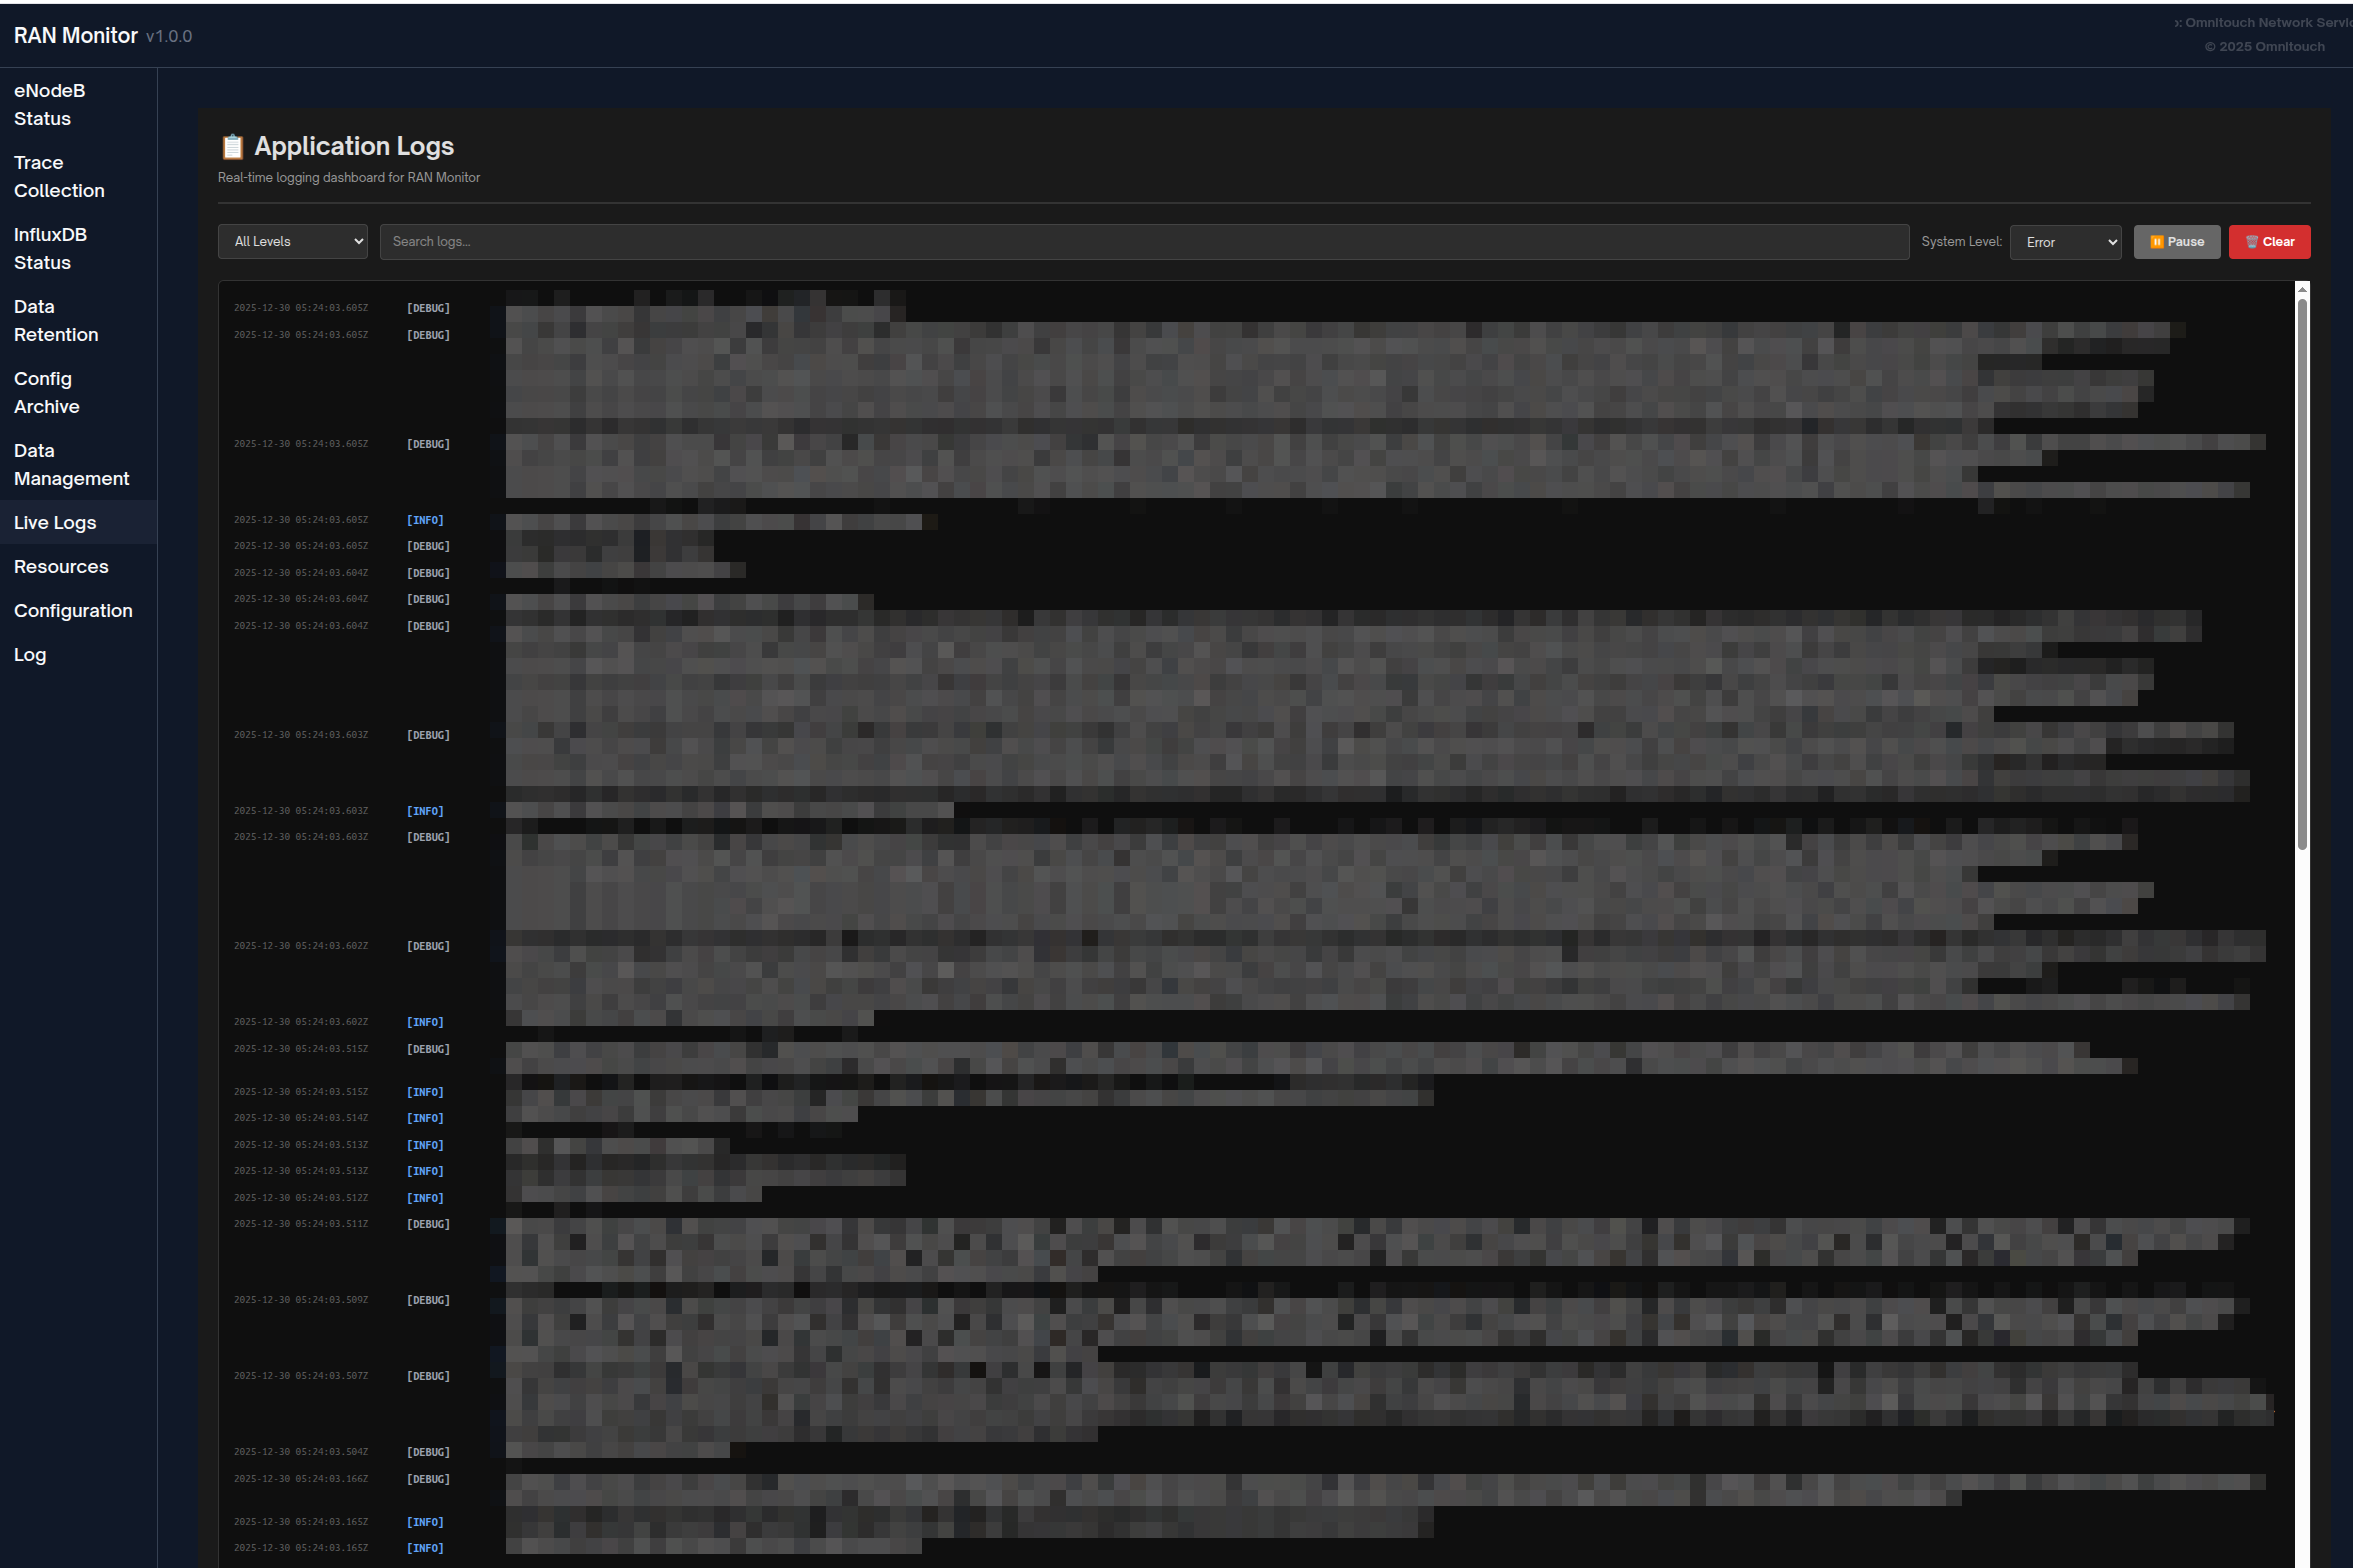
Application Logs
Real-time logging dashboard for troubleshooting:
- Filter by log level (Emergency through Debug)
- Search across all messages
- Pause/Resume live streaming
- Dynamically change system log level
- Color-coded by severity
For troubleshooting procedures, see the Troubleshooting Guide.
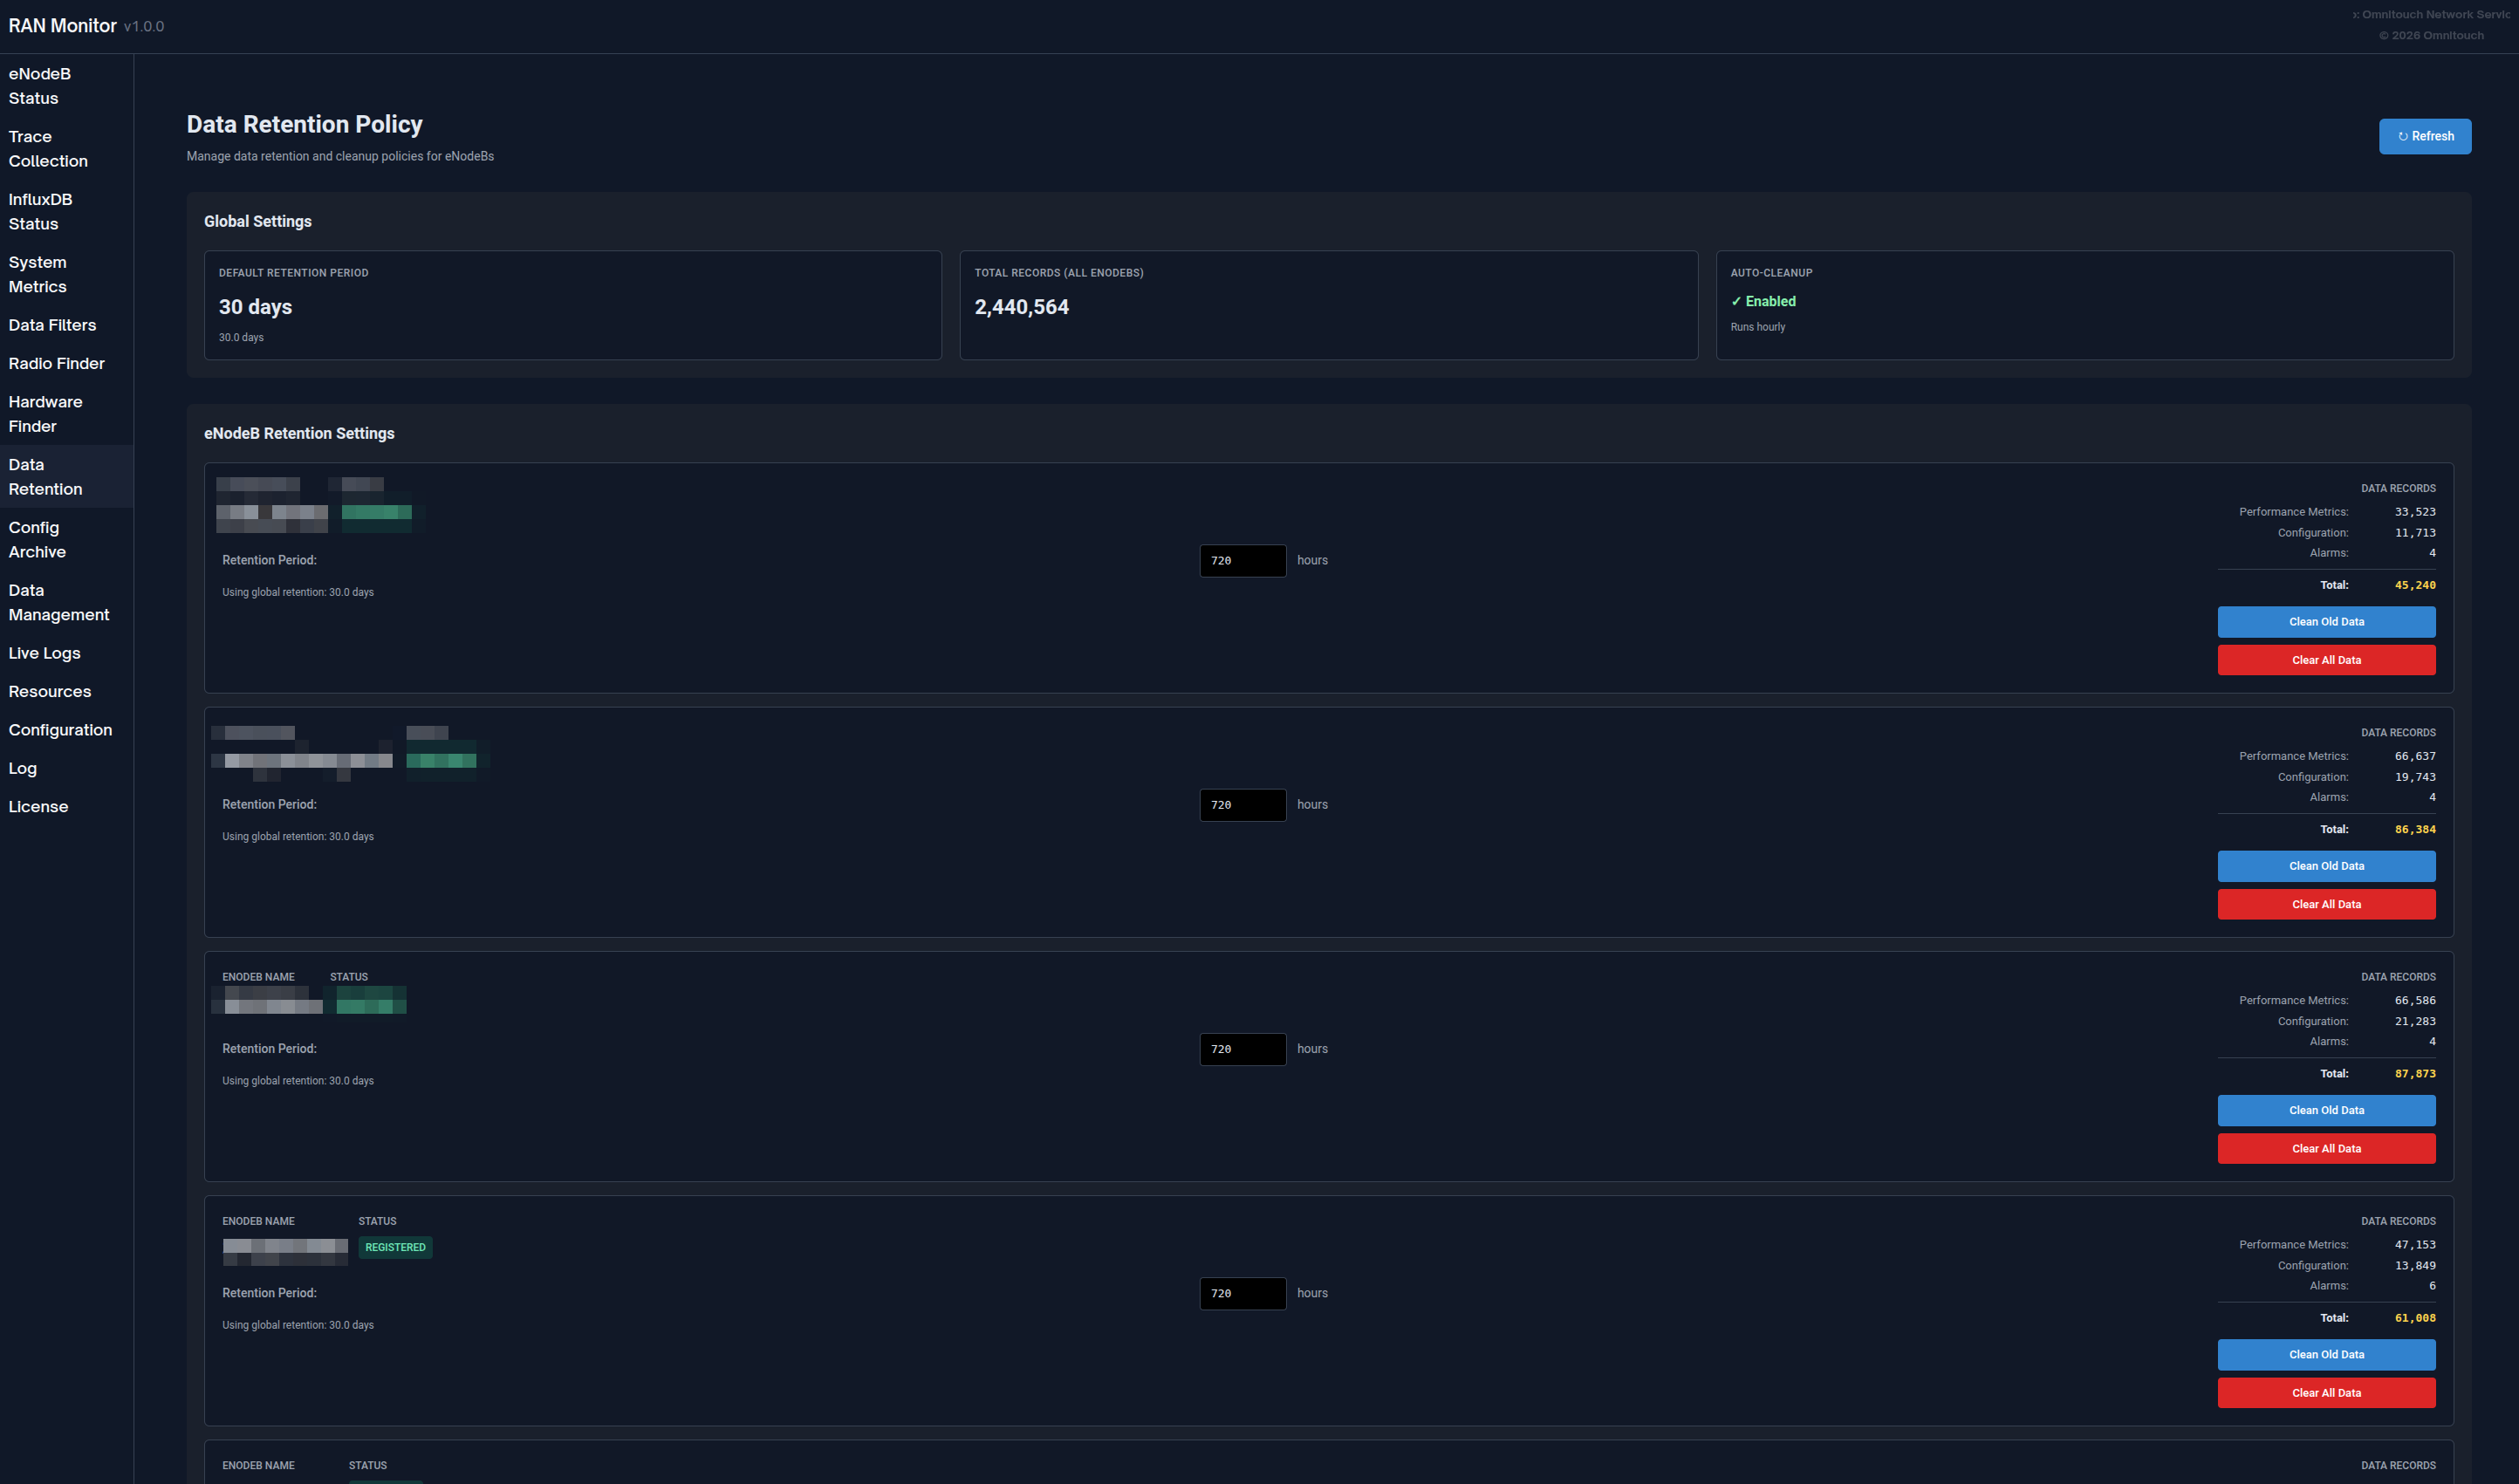
Data Retention Policy
Manage how long data is stored in InfluxDB:
- View global retention policy and total record counts
- Set per-device retention periods
- View record counts by measurement type (Performance Metrics, Configuration, Alarms)
- Manually trigger cleanup or clear all data for a device
For complete data retention information, see the Data Retention Policy Guide.
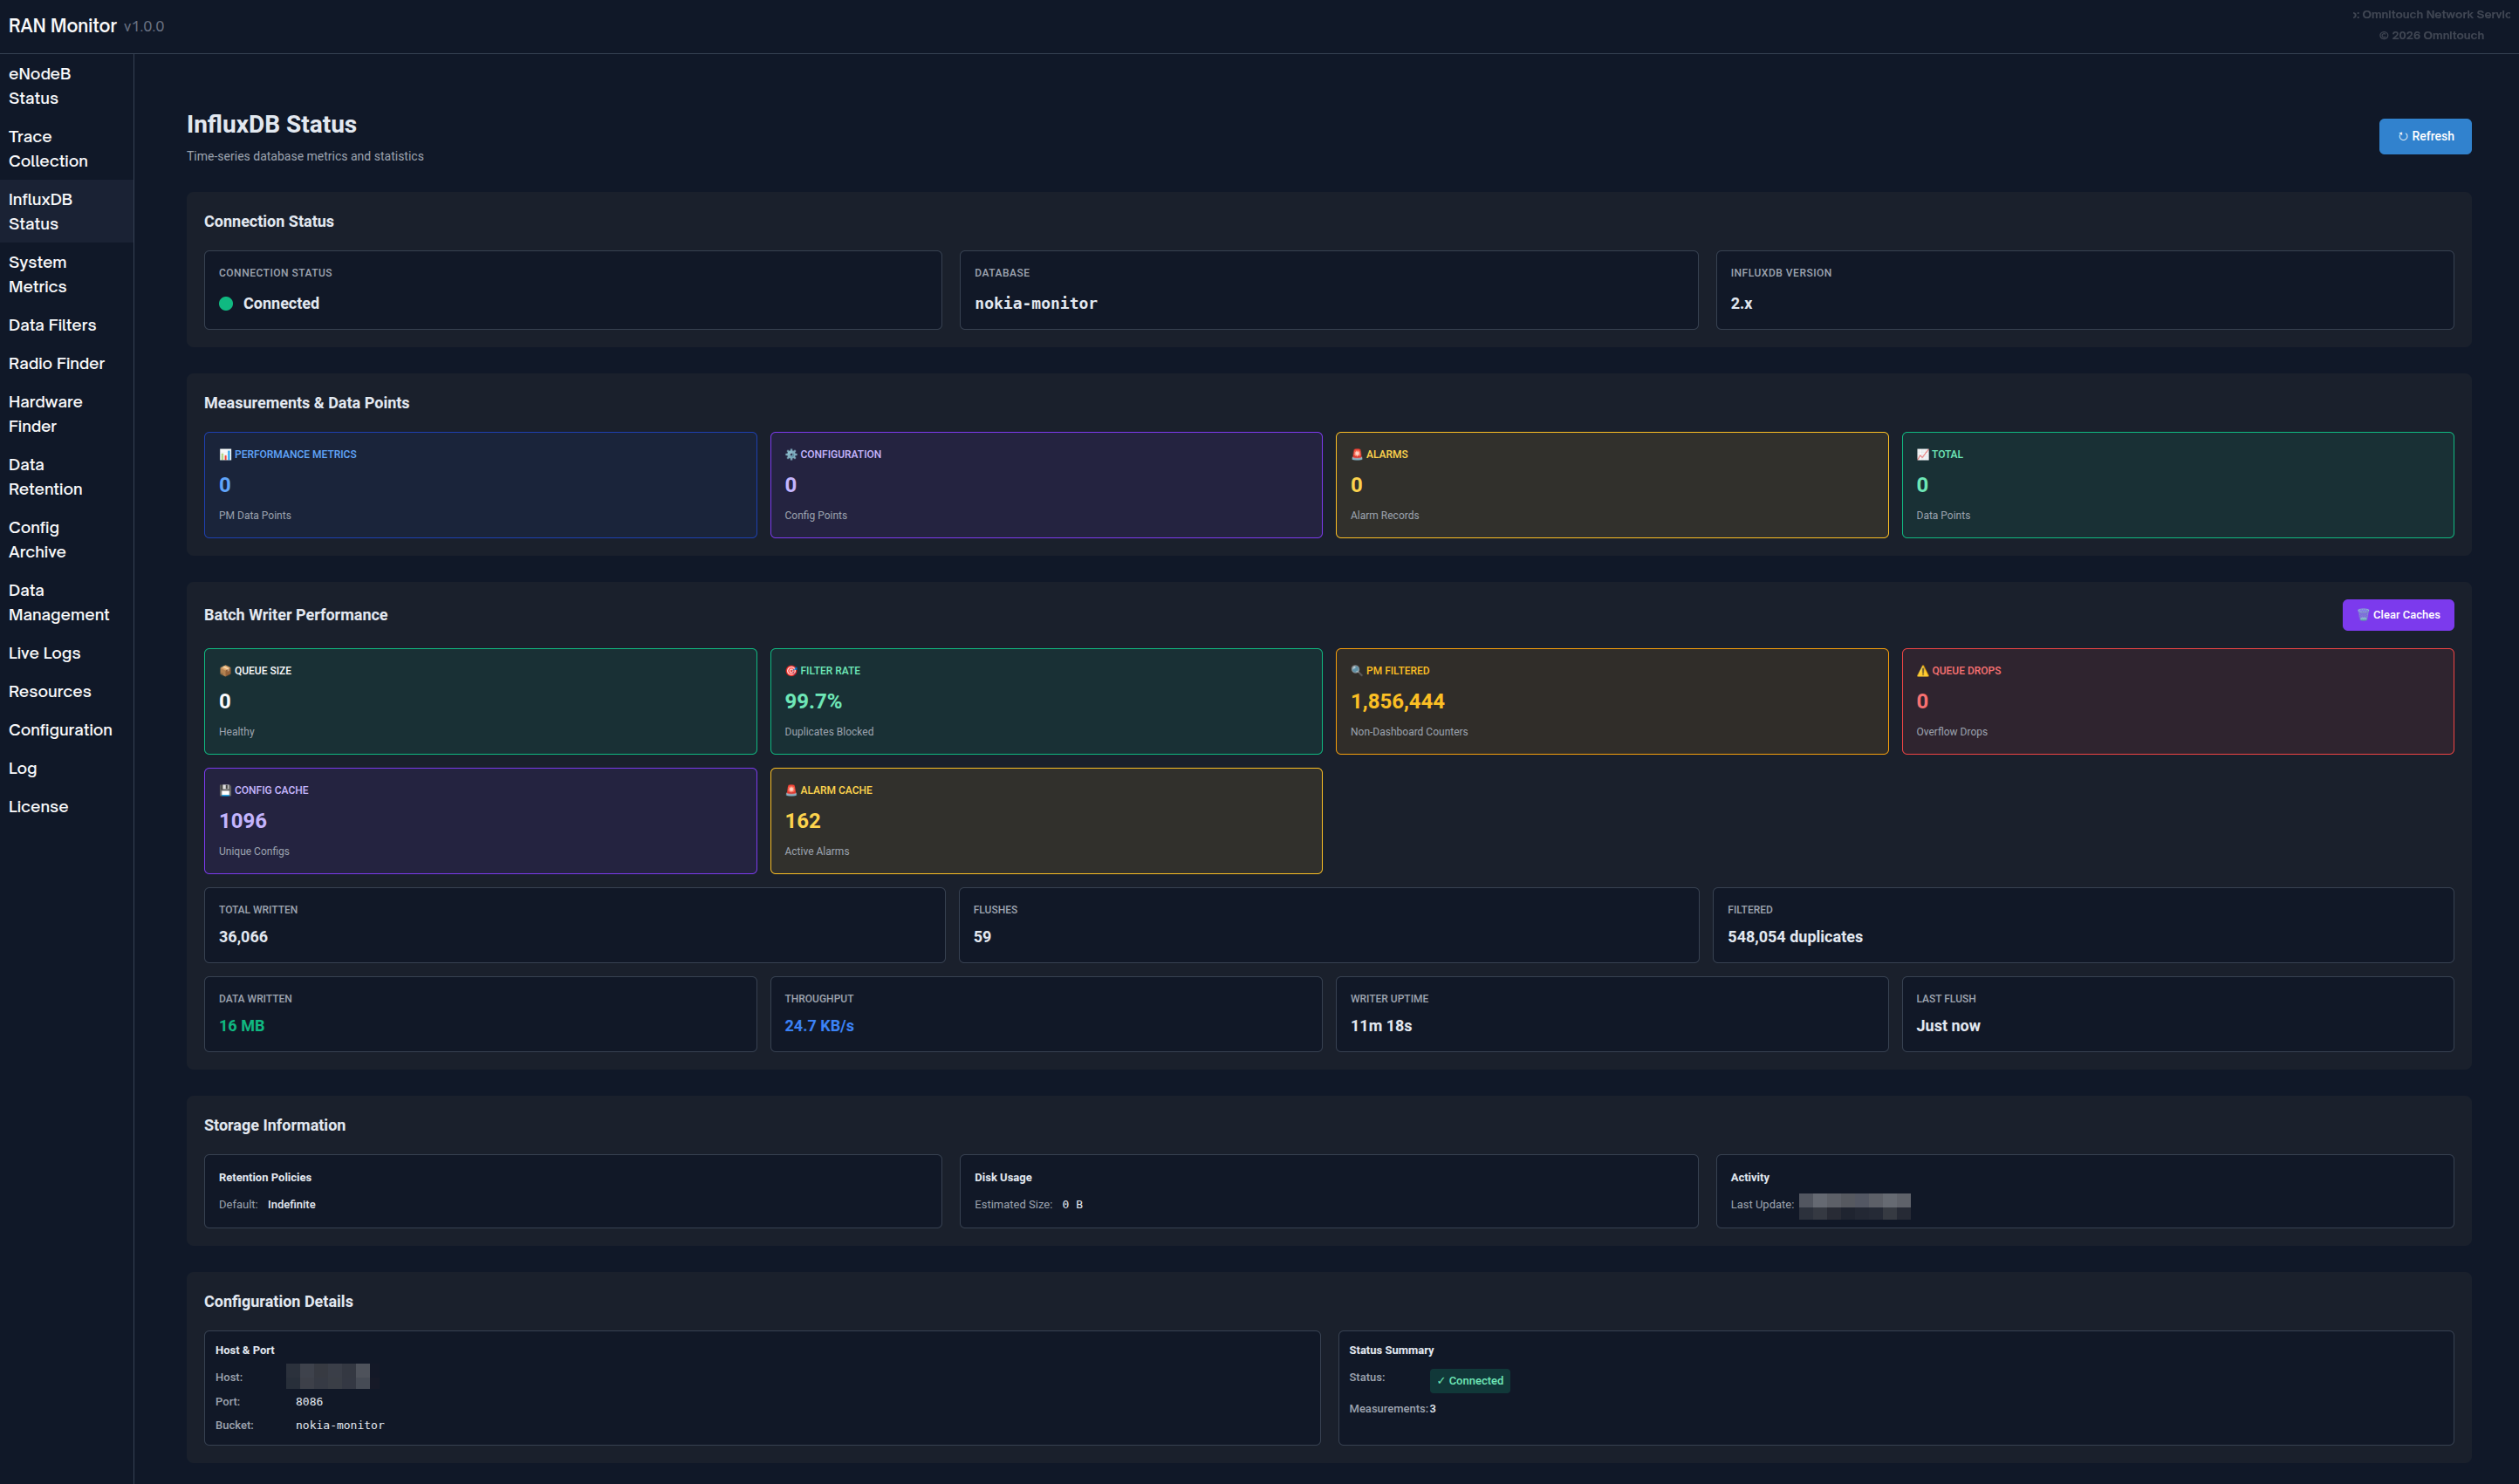
InfluxDB Status
Monitor time-series database health:
- Connection status indicator
- Measurement counts by type
- Storage information
- Database version and configuration
- Auto-refreshes every 5 minutes
Interpreting Status:
- Connected + Growing Counts = Normal operation
- Connected + No Data = Check device registration
- Disconnected = Check InfluxDB connectivity
Complete Web UI Guide
For comprehensive Web UI documentation including all features, workflows, and best practices, see:
Web UI Guide - Complete control panel reference
Monitoring with Grafana
While the Web UI provides real-time visibility, Grafana enables deep historical analysis and custom dashboards.
Why Use Grafana?
Grafana is Best For:
- Historical trend analysis over days/weeks/months
- Custom KPI dashboards tailored to your needs
- Long-term capacity planning
- Pattern identification and anomaly detection
- Executive reporting and SLA tracking
- Advanced alerting with notification channels
Web UI is Best For:
- Immediate device status checks
- Real-time alarm monitoring
- Configuration management
- Session troubleshooting
- System administration tasks
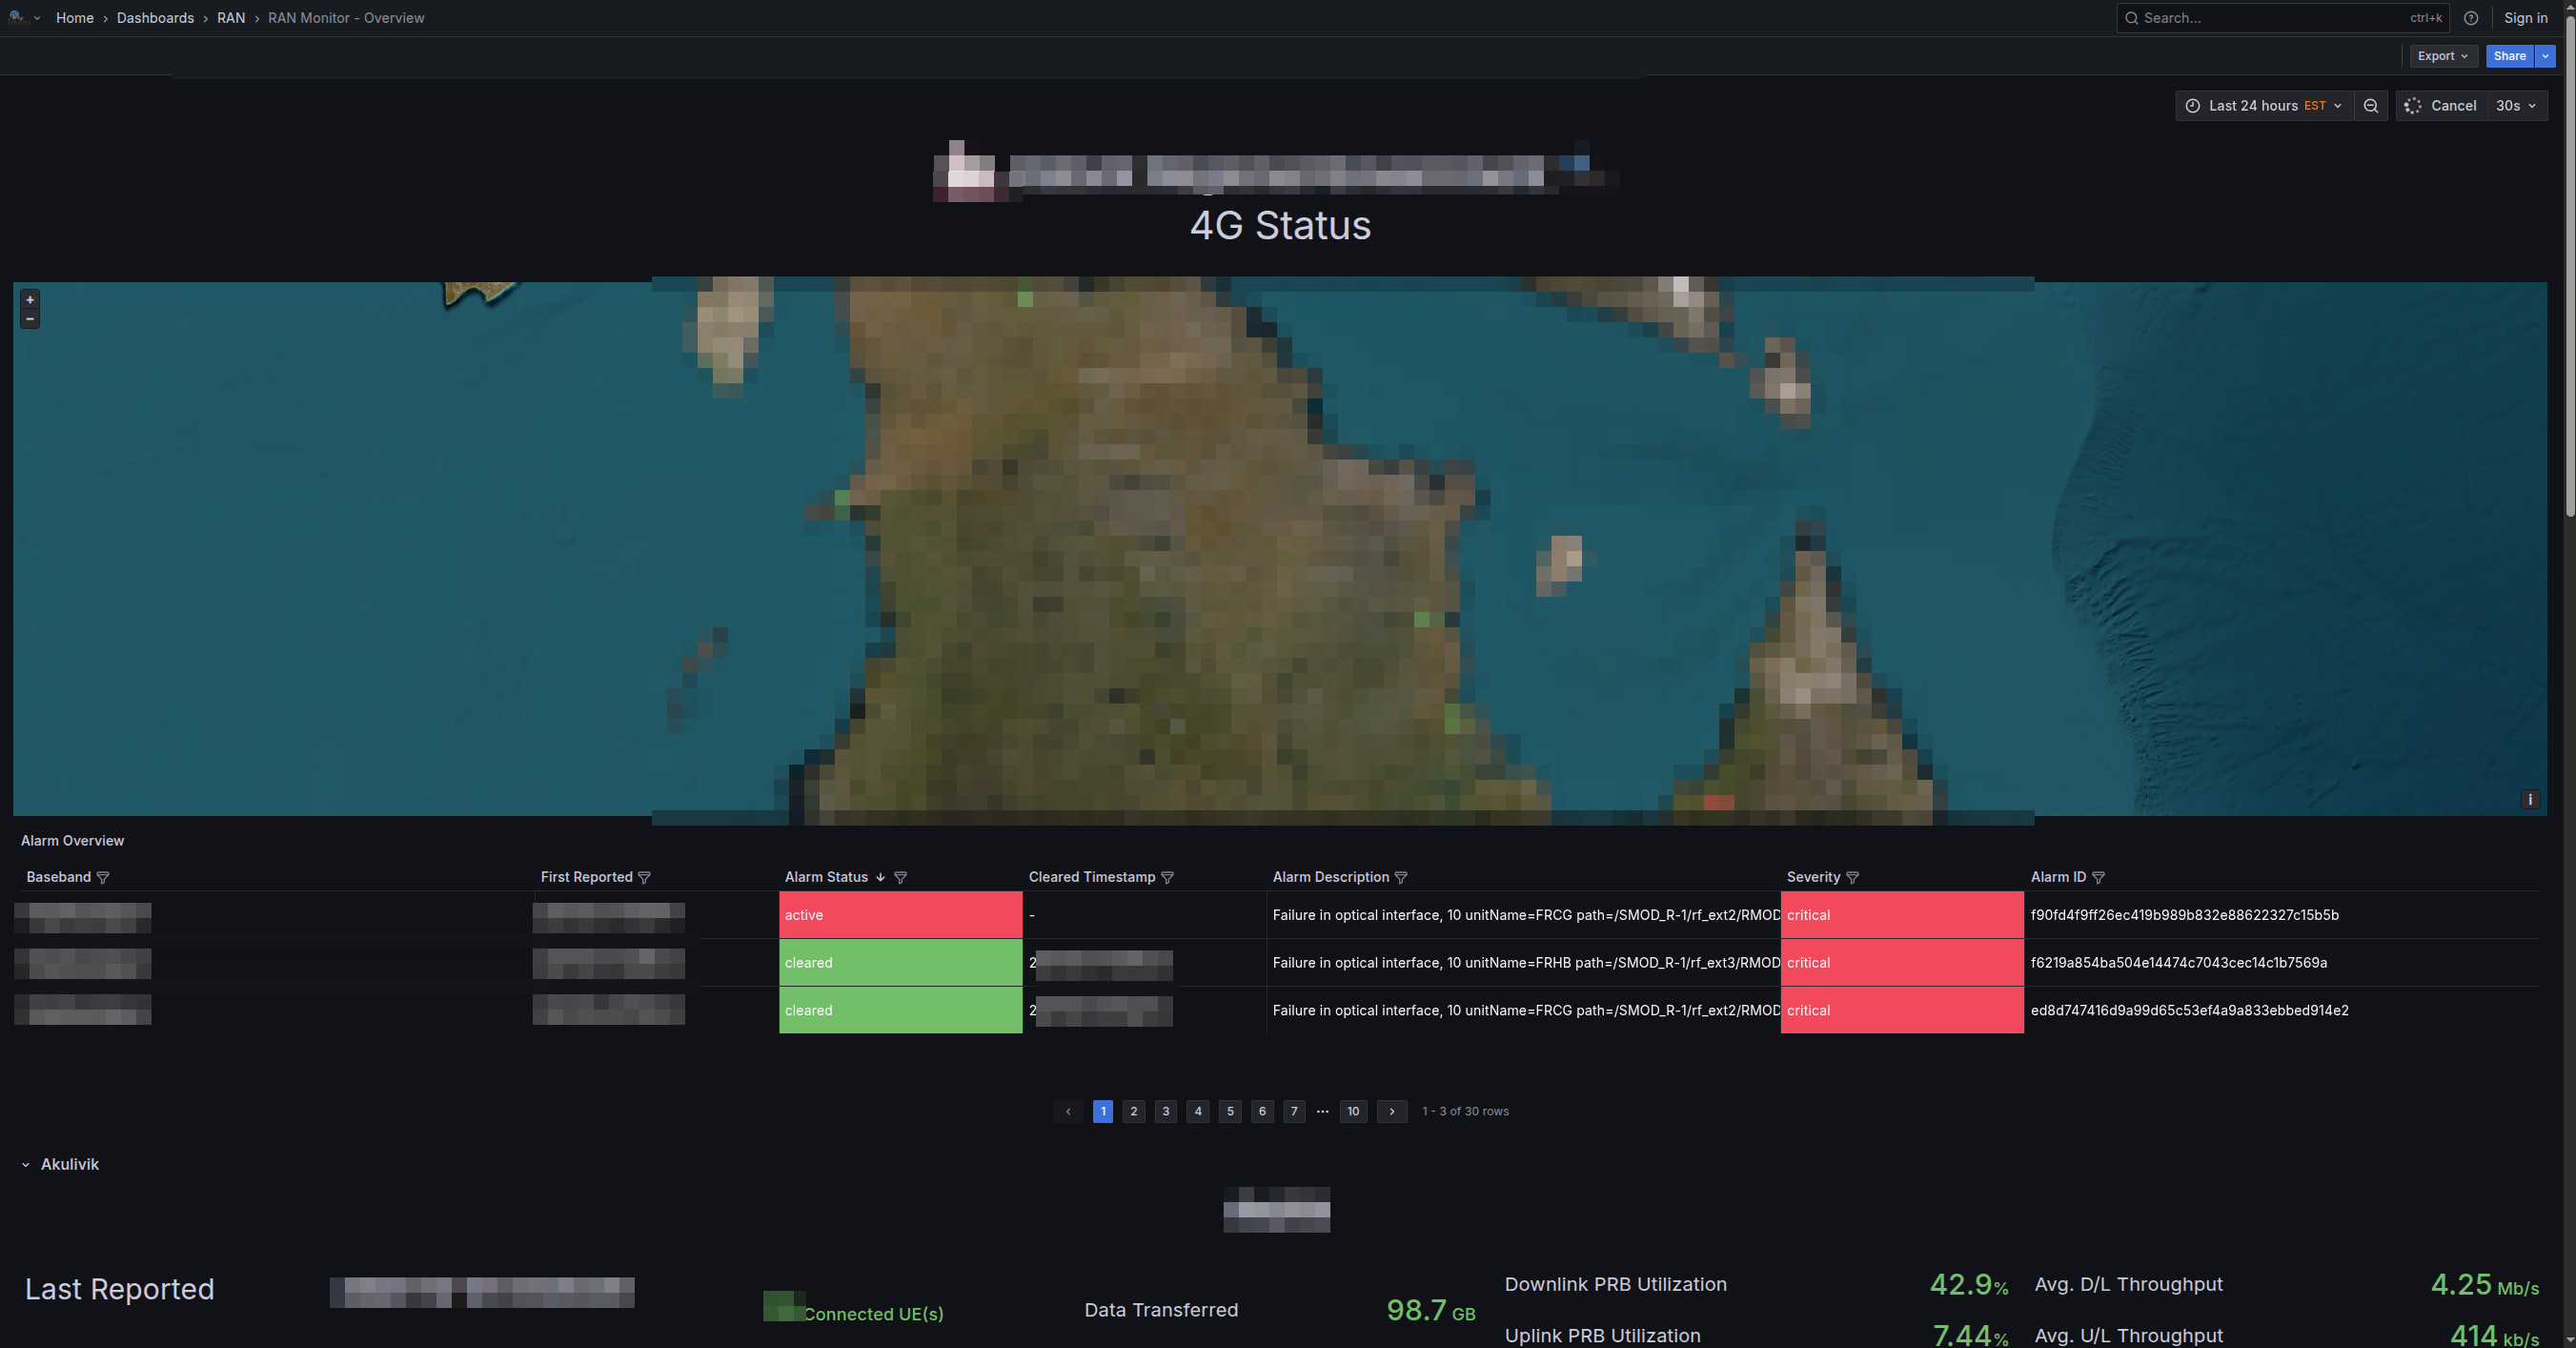
Example Grafana dashboard showing cell availability, throughput trends, and resource utilization
Dashboard Types
Executive Summary Dashboard:
- Network-wide health overview
- Total alarm count by severity
- Average cell availability across all sites
- Aggregate throughput and capacity metrics
- Device status grid
NOC Operations Dashboard:
- Real-time active issues table
- Resource utilization gauges
- Traffic overview (last 24 hours)
- Alarm trend charts
- Device status quick view
Engineering Deep-Dive Dashboard:
- Traffic pattern analysis
- Cell quality metrics (SINR, RSRP distributions)
- Radio performance (RLC retransmission, RRC setup success)
- Configuration audit trail
- Correlation analysis
Nokia AirScale Performance Dashboard:
- PRB utilization (DL/UL)
- Throughput trends (PDCP layer)
- Active UE counts
- Cell availability calculations
- Per-cell resource breakdowns
- RSSI measurements
- RRC connection setup success
- VSWR by antenna
- Power consumption
For complete dashboard examples, query patterns, and counter definitions, see:
Grafana Integration Guide - Complete analytics and dashboarding guide
Nokia Counter Reference - Performance counter definitions
Common Operations
Daily Operations
Daily Health Check (5-10 minutes):
- Open Web UI dashboard
- Verify all devices show green status
- Check alarm count and severity
- Review any failed devices
- Investigate issues as needed
For detailed procedures, see the Web UI Guide - Workflows.
Alarm Investigation:
- Open Alarms page, sort by severity
- Click alarm for full details
- Navigate to affected device
- Cross-reference with metrics
- Determine required action and resolve
For alarm handling procedures, see the Alarm Management Guide.
Device Management
Adding a New Base Station:
- Verify network connectivity to device
- Check Unconfigured eNodeBs page for device
- Add device to
config/runtime.exs - Restart RAN Monitor
- Verify registration succeeds (green status)
- Confirm metrics flowing to InfluxDB
Removing a Base Station:
- Decide whether to preserve or delete historical data
- Comment out or remove device from
config/runtime.exs - Optionally clear data via Data Retention page
- Restart RAN Monitor
- Update Grafana dashboards
Updating Device Credentials:
- Note current device status
- Update credentials in
config/runtime.exs - Restart RAN Monitor
- Verify reconnection succeeds
For complete operational procedures, see:
Common Operations Guide - Day-to-day management tasks
Configuration Management
Safe Configuration Update Workflow:
- Download current configuration (backup) - or retrieve from Config Archive
- Modify configuration offline
- Upload to device → get Plan ID
- Validate using Plan ID → verify no errors
- Activate if validation succeeds
- Verify changes took effect
- Monitor device stability for 15-30 minutes
- Confirm new version appears in Config Archive (within 1 hour)
Important: Always validate before activating. Schedule changes during maintenance windows when possible.
Configuration Rollback: If issues occur, download a previous version from Config Archive and upload it using the same workflow.
For base station configuration details, see the AirScale Configuration Guide.
For configuration history and versioning, see the Configuration Archive Guide.
Documentation Index
RAN Monitor documentation is organized by audience and use case:
For Operations Teams (NOC, Administrators)
| Document | Purpose | When to Use |
|---|---|---|
| Web UI Guide | Complete control panel reference | Daily operations, monitoring devices |
| Common Operations Guide | Day-to-day management tasks | Adding devices, managing configs, backups |
| Configuration Archive Guide | Config versioning and history | Tracking config changes, rollback, auditing |
| Firmware Management Guide | Software package repository | Uploading firmware, base station software updates |
| Alarm Management Guide | Alarm handling and escalation | Investigating faults, responding to alerts |
| Troubleshooting Guide | Problem resolution procedures | When issues occur, error diagnosis |
| Data Retention Policy Guide | Data lifecycle management | Managing storage, setting retention periods |
For Engineering and Analytics
| Document | Purpose | When to Use |
|---|---|---|
| Grafana Integration Guide | Dashboards, queries, and alerting | Building dashboards, setting up alerts |
| Nokia Counter Reference | Performance counter definitions | Understanding metrics, creating queries |
| AirScale Configuration Guide | Base station setup and configuration | Configuring devices, understanding parameters |
| TCE MDT Data Collection Guide | MDT trace collection and Wireshark analysis | Collecting drive test data, coverage optimization |
| API Endpoints Reference | REST API documentation | Integrations, automation, scripting |
For Configuration and Deployment
| Document | Purpose | When to Use |
|---|---|---|
| Runtime Configuration Guide | Complete configuration reference | Initial setup, modifying settings |
Quick Start
New to RAN Monitor?
- Start with Web UI Guide to learn the interface
- Review Common Operations Guide for routine tasks
- Study Alarm Management Guide for alarm handling
- Keep Troubleshooting Guide bookmarked for issues
Setting Up Monitoring?
- See Grafana Integration Guide for dashboards
- Reference Nokia Counter Reference for metrics
- Review Data Retention Policy Guide for storage management
Quick Reference
Access Points
| Service | URL | Purpose |
|---|---|---|
| Web UI Dashboard | https://<server>:9443 | Real-time monitoring and management |
| Grafana | http://<server>:3000 | Analytics dashboards and alerts |
| InfluxDB | http://<server>:8086 | Metrics database (usually internal access only) |
Important Paths
| Path | Purpose |
|---|---|
config/runtime.exs | Main configuration file (devices, databases, settings) |
priv/cert/ | SSL certificates for HTTPS Web UI |
priv/external/nokia/ | Manager authentication keys |
priv/airscale_configs/ | Configuration archive (versioned XML files) |
Key Concepts
Session Management:
- RAN Monitor establishes sessions with base stations
- Sessions have expiry times and require keep-alive
- Re-registration happens automatically (default: every 30 seconds)
- Session state stored in MySQL database
Data Flow:
- Metrics collected every 10 seconds (configurable)
- Alarms collected every 10 seconds via polling + real-time webhooks
- Configuration snapshots every 1 hour (saved as versioned files when changed)
- Performance metrics and alarms written to InfluxDB for historical storage
Data Retention:
- Global default: 720 hours (30 days)
- Per-device overrides available
- Automatic cleanup runs hourly
- Manual cleanup available via Web UI
For configuration details, see the Runtime Configuration Guide.
Common Workflows
Daily Health Check:
- Open Web UI → Dashboard
- Check device status (all green?)
- Review alarm count
- Investigate any issues
Respond to Critical Alarm:
- Web UI → Alarms → Sort by severity
- Click alarm for details
- Navigate to device
- Review recent metrics and config changes
- Implement resolution
- Verify alarm clears
Add New Device:
- Verify network connectivity
- Edit
config/runtime.exs - Add device to airscales list
- Restart RAN Monitor
- Verify registration (green status)
Support
Troubleshooting Resources
| Resource | Use For |
|---|---|
| Troubleshooting Guide | Common issues and solutions |
| Application Logs Page | Real-time system logs and errors |
| Device Detail View | Session status, registration issues |
| InfluxDB Status Page | Data collection verification |
Quick Diagnostic Steps
Device Not Connecting:
- Check Base Stations page → device status
- Verify network connectivity:
ping <device-ip> - Check credentials in
config/runtime.exs - Review Application Logs for errors
No Metrics in Grafana:
- Check device is associated (green status)
- Verify InfluxDB Status page shows growing counts
- Test InfluxDB connectivity
- Check Grafana data source configuration
Web UI Not Loading:
- Verify port 9443 is accessible
- Check firewall allows HTTPS traffic
- Verify SSL certificates exist
- Review application logs for Web UI startup errors
For complete troubleshooting procedures, see the Troubleshooting Guide.
Getting Help
Before Contacting Support:
Gather this information:
- Problem description and when it started
- Error messages from Application Logs
- Affected devices (names/IPs)
- Recent configuration changes
- RAN Monitor version and OS
Contact:
For assistance with RAN Monitor:
- Omnitouch Network Services support
- Include gathered diagnostic information
- Provide configuration files (sanitize passwords)
- Include relevant log excerpts
Self-Service:
- Search the Troubleshooting Guide
- Check Application Logs for specific errors
- Review recent configuration changes
- Test connectivity and basic functionality
- Consult relevant documentation guides