OmniWeb Operations Guide
OmniWeb is Omnitouch's unified, web-based management portal for an entire mobile core network. It is a single pane of glass that brings real-time monitoring, configuration, protocol tracing, log analysis, dashboards, and software lifecycle management for every network function (NF) into one interface — EPC, IMS, CS Core, 5G Core, SS7, messaging, charging, and the supporting infrastructure that runs them.
Instead of logging into a dozen element CLIs, Grafana, Loki, and Homer separately, an operator opens OmniWeb and can:
- See the whole network at a glance through interactive topology maps and per-element health.
- View, edit, and change NF setups — add a route in the SMSC, provision a subscriber in the HSS, clear a session on the UPF — through one consistent UI.
- Watch real-time, structured logs for any element and trace a single subscriber across the entire network (Diameter, GTP-C, PFCP, SIP, MAP).
- Open Grafana dashboards and statistics embedded inline, without leaving the portal.
- Manage software versions and lifecycle across the fleet.
Every network function is operated through the same set of patterns. This guide documents those generic patterns once — they apply to every NF.
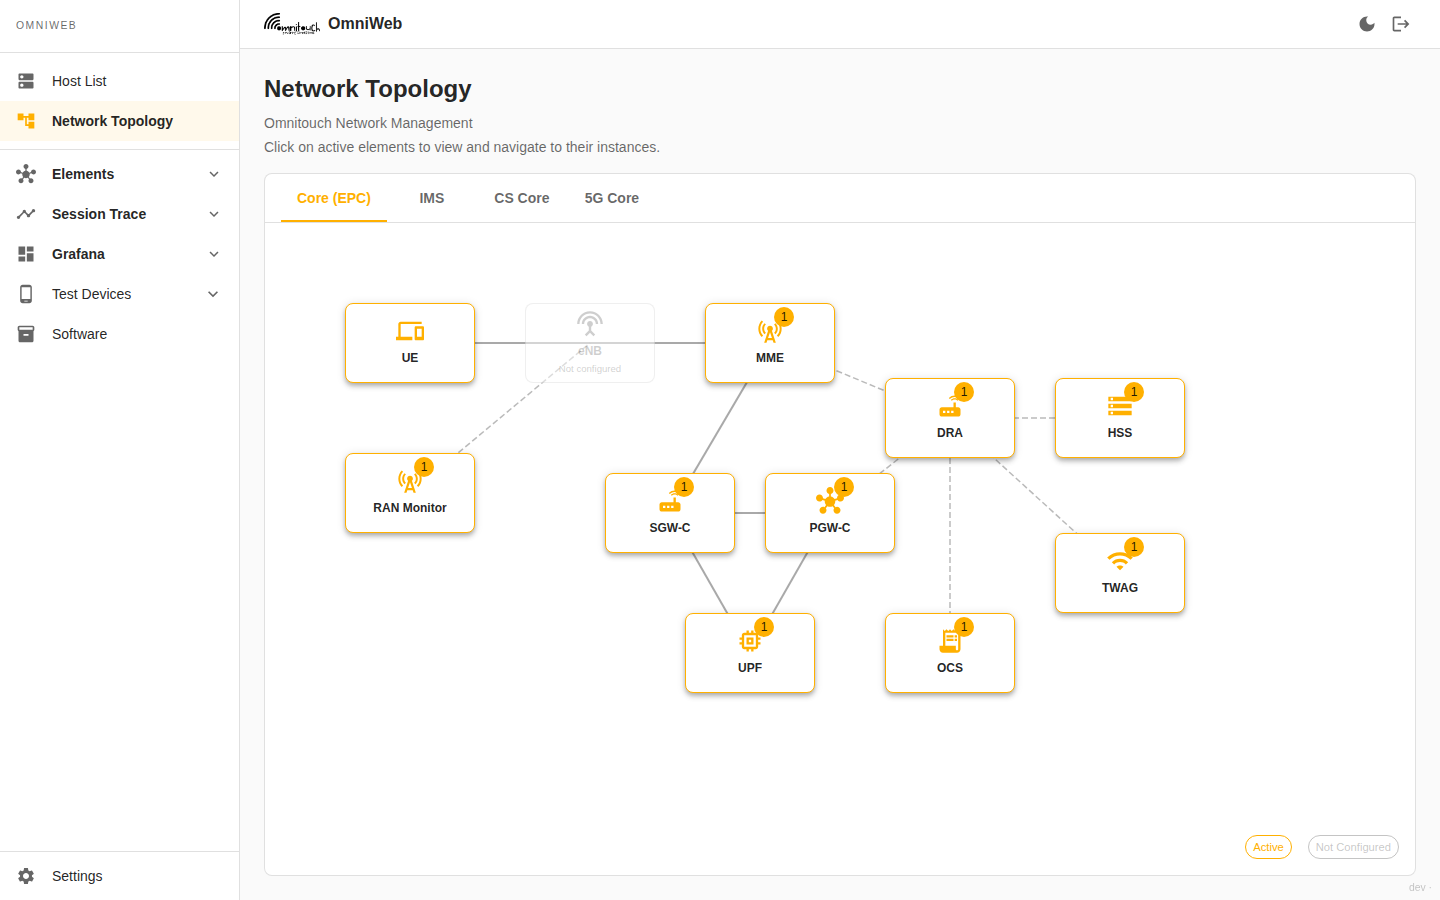
OmniWeb's topology view — the single pane of glass across EPC, IMS, CS Core, and 5G Core. Active elements are clickable and lead straight into their management pages.
Documentation Map
Start Here
- Architecture — How OmniWeb works: the SPA, the backend proxy, the configuration model, and how it talks to every NF, Loki, and Grafana.
- Common Operations — The patterns shared by every element: how to view, edit, and change NF setups; how to read logs; how polling, configuration viewing, and RBAC behave. Read this once and it applies everywhere.
Observability & Troubleshooting
- Grafana Dashboards & Statistics — Embedded dashboards, element statistics, and alerting.
- Logs & Subscriber Tracing — Real-time Loki structured logs, cross-network Session Trace (follow one subscriber end to end), and Homer SIP capture.
- Network Topology — The single-pane-of-glass topology views and the infrastructure Host List.
Platform
- API Reference (OpenAPI / Swagger) — Browse and try the controller REST API at
/api/docs; the OpenAPI spec lives at/api/openapi.json. - Software Management — Versioning, APT repository, and software lifecycle.
- Test Devices — Remotely control ADB-connected phones at remote sites; place calls, send texts, and run scheduled VoLTE / signal / connectivity tests exported to Prometheus.
- OmniRoam — Roaming Test Automation — Run the GSMA roaming test books (IR.38, IR.48, VoLTE) automatically against a live network, capture pass/fail with evidence, schedule routine runs, and export the completed GSMA workbook. Links to Test Books, Running Tests, the Test Book Explorer, and Completed Documents.
- SIM Bank — Distributed inventory of every SIM in every reader across all agents — reader-centric, with card presence, identity, and per-slot filesystem/APDU tools.
- Remote SIM & Virtual SIM — Present any SIM to any modem over the network via card emulators, and emulate a virtual SIM (saved image + HSS keys) so a modem attaches as a subscriber you have no physical card for.
- OTA SIM Management — Read and edit a remote SIM's files over the air with secured (03.48 / SCP80) RFM/RAM packets — a reader on the host, a remote agent, or SMPP to a field SIM — plus reusable security profiles and fan-out campaigns.
- Authentication & Access Control — Overview of the access-control model, linking to:
- Login & JWT Sessions — login flow, token lifetime, one-login-spans-stack.
- Role-Based Access Control — per-element, per-method permissions and enforcement.
- LDAP & SSH Key Sync — central host SSH access.
- Audit Logging — portal, SSH-login, and command (snoopy) audit.
Architecture at a Glance
Every request from the browser carries a JWT. The backend verifies it, checks role-based permissions for the target element and HTTP method, then forwards (proxies) the call to the element's own management API. Grafana, Loki, and Homer are reached through the same authenticated gateway, so a single OmniWeb login governs the entire stack. See Architecture for the full breakdown.
Supported Network Functions
OmniWeb administers every function in the Omnitouch core. They are all managed through the same generic patterns described in Common Operations — this is the inventory of what can be administered, not a per-element manual.
| Domain | Network functions |
|---|---|
| EPC | HSS, MME, SGW-C, PGW-C / SMF, UPF |
| IMS | P-CSCF, I-CSCF, S-CSCF, TAS, ePDG, Entitlement (OmniSEP) |
| CS Core & SS7 | MSC, STP, HLR, CAMEL Gateway |
| Messaging | SMSC, SMPP Gateway, IP-SM-GW, DRA |
| Charging & Access | OCS, TWAG, RAN Monitor, License Server |
Adding another instance of any of these is a configuration change only — see the configuration model. OmniWeb deployment and configuration is managed via Ansible; do not edit configuration files directly on hosts. When multiple instances of the same type are present, OmniWeb provides a per-instance dropdown and a fleet view for aggregate status — see Multi-Instance & Fleet Views.
What You Can Do With OmniWeb
Every task below uses the same generic mechanics, documented in Common Operations.
| Goal | Where in OmniWeb | How it works |
|---|---|---|
| Get a network-wide overview | Topology views (EPC / IMS / CS Core / 5GC) | Topology |
| Provision or edit a subscriber | Element → data tab → add/edit form | Editing & Changing NF Setups |
| Add or change a route | Element → Routing → add/edit form | Editing & Changing NF Setups |
| Clear / release a session or call | Element → Sessions / Calls → action | Running Actions |
| Read configuration (secrets masked) | Element → Configuration | Viewing Configuration |
| Watch live logs for an element | Element → Logs | Logs & Tracing |
| Follow one subscriber across the network | Session Trace → search IMSI/MSISDN | Logs & Tracing |
| Analyse a SIP/VoIP call flow in detail | Homer (sidebar, auto-detected) | Homer SIP Capture |
| View dashboards & statistics | Element → Dashboards, or Grafana sidebar | Grafana |
| Manage software versions | Software | Software Management |
| Test a real phone at a remote site | Test Devices → fleet / console | Test Devices |
| Run a GSMA roaming test book | Roaming Tests → Test Books | OmniRoam |
| Read or edit a SIM's files over the air | SIMs → OTA | OTA SIM Management |
| Manage users & permissions | Settings → Permissions | Authentication |
Real-Time Polling (applies everywhere)
All operational pages auto-refresh on a configurable interval. A Polling Indicator in each page header shows:
- Whether polling is active (green dot) or paused.
- The polling interval (typically 5 seconds; configurable per element via
pollIntervalMs). - Whether a fetch is currently in progress (spinner).
- The timestamp of the last successful update.
Polling can be toggled on or off per page. Some pages — interactive consoles and diagnostics tools — do not poll automatically and require a manual refresh. Polling behaviour is documented once in Common Operations.